

Nationally, the average cost to build out an office is $196.49/sf. But after taking into account the average landlord-provided tenant-improvement allowance of $43.61/sf, the out-of-pocket cost for tenants is $152.88/sf, according to JLL’s new U.S. Fit Out Guide.
The report combines fitout costs and tenant improvement allowances to paint a comprehensive picture of what companies can expect to pay out of pocket for an office buildout across the nation. It also details the most- and least-expensive markets for fitouts.
Coming out on top as the most expensive market to build out an office is Silicon Valley, Calif., with an out-of-pocket cost of $199.22. The most affordable market: Washington, D.C., at $103.88.
“It’s no surprise that the Northwest continues to be the most expensive region for office builds,” says Mason Mularoni, Senior Research Analyst, JLL Project and Development Services. Southern cities claimed six out of the 10 most affordable markets.
Due to the range of landlord-provided tenant improvement packages, some cities that made the top lists were pretty unexpected.
 Silicon Valley, Calif., is the most expensive market for office fitout projects, with an average out-of-pocket cost of $199.22/sf, according to JLL.
Washington, D.C.: most affordable. Often topping most-expensive lists, the District of Columbia is officially the most inexpensive market to build out an office space. As the federal government, contractors, and law firms continue to consolidate, slightly below-average buildout costs are offset by record-high concession packages from landlords who are desperate to get tenants into the exploding mass of available space.
Detroit: eighth most expensive. Once on the brink of financial collapse, the Motor City is being reinvigorated by an eager tech community. Startups, investors, and outside firms are attracted to the Motor City’s resolve to bounce back.
But Detroit isn’t in the clear just yet. Due to above-average buildout costs and minimal TI packages, the city swings in as one of the top out-of-pocket cost markets.
Los Angeles: sixth most affordable market to build out an office. New leasing activity has been nourished by the convergence of media, technology, and entertainment. The tech sector in particular has shown a preference for creative buildouts. LA’s enormous TI packages are tied with Washington, D.C., for largest in the nation, offering an affordable option in the notoriously expensive state.
Long Island, N.Y.: third most expensive, beating out traditional frontrunner New York City. When it comes to building costs alone, New York City tops the list. But substantial TI packages in the city allow Long Island to slide ahead in out-of-pocket costs, holding its own against the expensive Northern California cities.
Seattle: seventh most affordable. Although the Northwest region tops the most expensive list, Seattle is the exception to the rule. Technology continues to be the primary factor of the city, and significant growth is occurring from local companies as well as from tenants migrating from the Bay Area.
The second-largest TI package average across the nation enables Seattle to hold down seventh place in most-affordable-city honors.
Related Stories

Market Data | Oct 30, 2018
Construction projects planned and ongoing by world’s megacities valued at $4.2trn
The report states that Dubai tops the list with total project values amounting to US$374.2bn.
Market Data | Oct 26, 2018
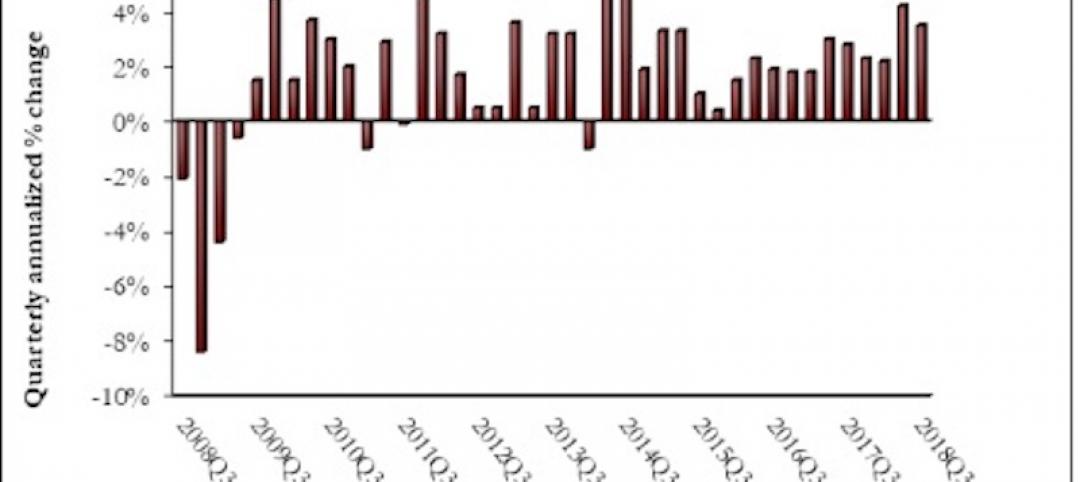
Nonresidential fixed investment returns to earth in Q3
Despite the broader economic growth, fixed investment inched 0.3% lower in the third quarter.
Market Data | Oct 24, 2018
Architecture firm billings slow but remain positive in September
Billings growth slows but is stable across sectors.
Market Data | Oct 19, 2018
New York’s five-year construction spending boom could be slowing over the next two years
Nonresidential building could still add more than 90 million sf through 2020.
Market Data | Oct 8, 2018
Global construction set to rise to US$12.9 trillion by 2022, driven by Asia Pacific, Africa and the Middle East
The pace of global construction growth is set to improve slightly to 3.7% between 2019 and 2020.
Market Data | Sep 25, 2018
Contractors remain upbeat in Q2, according to ABC’s latest Construction Confidence Index
More than three in four construction firms expect that sales will continue to rise over the next six months, while three in five expect higher profit margins.
Market Data | Sep 24, 2018
Hotel construction pipeline reaches record highs
There are 5,988 projects/1,133,017 rooms currently under construction worldwide.
Market Data | Sep 21, 2018
JLL fit out report portrays a hot but tenant-favorable office market
This year’s analysis draws from 2,800 projects.
Market Data | Sep 21, 2018
Mid-year forecast: No end in sight for growth cycle
The AIA Consensus Construction Forecast is projecting 4.7% growth in nonresidential construction spending in 2018.

Market Data | Sep 19, 2018
August architecture firm billings rebound as building investment spurt continues
Southern region, multifamily residential sector lead growth.


