

Nationally, the average cost to build out an office is $196.49/sf. But after taking into account the average landlord-provided tenant-improvement allowance of $43.61/sf, the out-of-pocket cost for tenants is $152.88/sf, according to JLL’s new U.S. Fit Out Guide.
The report combines fitout costs and tenant improvement allowances to paint a comprehensive picture of what companies can expect to pay out of pocket for an office buildout across the nation. It also details the most- and least-expensive markets for fitouts.
Coming out on top as the most expensive market to build out an office is Silicon Valley, Calif., with an out-of-pocket cost of $199.22. The most affordable market: Washington, D.C., at $103.88.
“It’s no surprise that the Northwest continues to be the most expensive region for office builds,” says Mason Mularoni, Senior Research Analyst, JLL Project and Development Services. Southern cities claimed six out of the 10 most affordable markets.
Due to the range of landlord-provided tenant improvement packages, some cities that made the top lists were pretty unexpected.
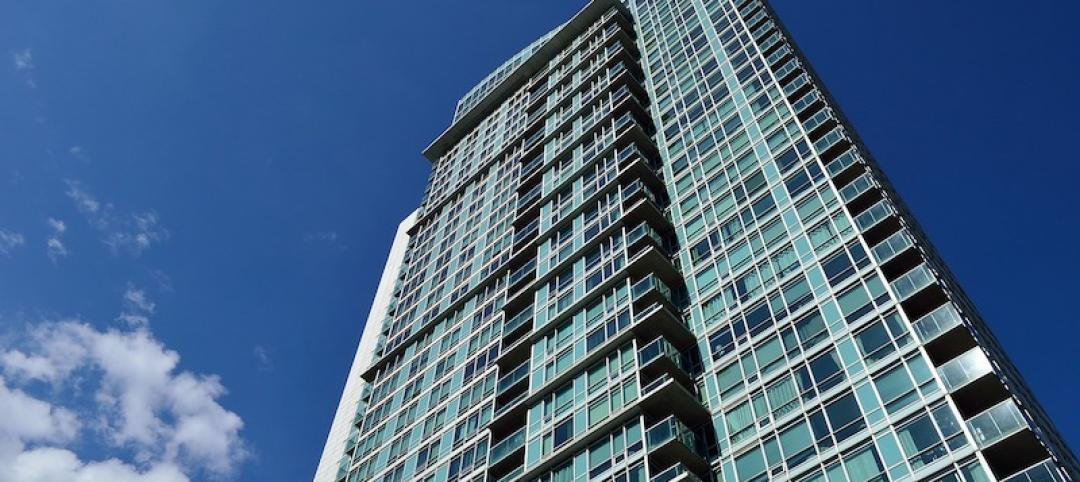
 Silicon Valley, Calif., is the most expensive market for office fitout projects, with an average out-of-pocket cost of $199.22/sf, according to JLL.
Washington, D.C.: most affordable. Often topping most-expensive lists, the District of Columbia is officially the most inexpensive market to build out an office space. As the federal government, contractors, and law firms continue to consolidate, slightly below-average buildout costs are offset by record-high concession packages from landlords who are desperate to get tenants into the exploding mass of available space.
Detroit: eighth most expensive. Once on the brink of financial collapse, the Motor City is being reinvigorated by an eager tech community. Startups, investors, and outside firms are attracted to the Motor City’s resolve to bounce back.
But Detroit isn’t in the clear just yet. Due to above-average buildout costs and minimal TI packages, the city swings in as one of the top out-of-pocket cost markets.
Los Angeles: sixth most affordable market to build out an office. New leasing activity has been nourished by the convergence of media, technology, and entertainment. The tech sector in particular has shown a preference for creative buildouts. LA’s enormous TI packages are tied with Washington, D.C., for largest in the nation, offering an affordable option in the notoriously expensive state.
Long Island, N.Y.: third most expensive, beating out traditional frontrunner New York City. When it comes to building costs alone, New York City tops the list. But substantial TI packages in the city allow Long Island to slide ahead in out-of-pocket costs, holding its own against the expensive Northern California cities.
Seattle: seventh most affordable. Although the Northwest region tops the most expensive list, Seattle is the exception to the rule. Technology continues to be the primary factor of the city, and significant growth is occurring from local companies as well as from tenants migrating from the Bay Area.
The second-largest TI package average across the nation enables Seattle to hold down seventh place in most-affordable-city honors.
Related Stories

Market Data | Aug 10, 2018
Construction material prices inch down in July
Nonresidential construction input prices increased fell 0.3% in July but are up 9.6% year over year.

Market Data | Aug 9, 2018
Projections reveal nonresidential construction spending to grow
AIA releases latest Consensus Construction Forecast.
Market Data | Aug 7, 2018
New supply's impact illustrated in Yardi Matrix national self storage report for July
The metro with the most units under construction and planned as a percent of existing inventory in mid-July was Nashville, Tenn.
Market Data | Aug 3, 2018
U.S. multifamily rents reach new heights in July
Favorable economic conditions produce a sunny summer for the apartment sector.
Market Data | Aug 2, 2018
Nonresidential construction spending dips in June
“The hope is that June’s construction spending setback is merely a statistical aberration,” said ABC Chief Economist Anirban Basu.

Market Data | Aug 1, 2018
U.S. hotel construction pipeline continues moderate growth year-over-year
The hotel construction pipeline has been growing moderately and incrementally each quarter.
Market Data | Jul 30, 2018
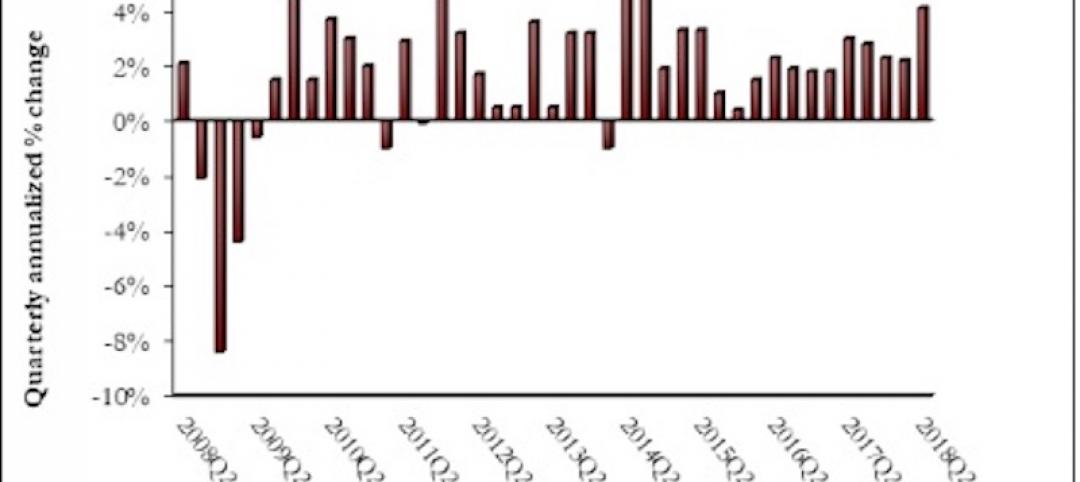
Nonresidential fixed investment surges in second quarter
Nonresidential fixed investment represented an especially important element of second quarter strength in the advance estimate.
Market Data | Jul 11, 2018
Construction material prices increase steadily in June
June represents the latest month associated with rapidly rising construction input prices.
Market Data | Jun 26, 2018
Yardi Matrix examines potential regional multifamily supply overload
Outsize development activity in some major metros could increase vacancy rates and stagnate rent growth.

Market Data | Jun 22, 2018
Multifamily market remains healthy – Can it be sustained?
New report says strong economic fundamentals outweigh headwinds.


