

Nationally, the average cost to build out an office is $196.49/sf. But after taking into account the average landlord-provided tenant-improvement allowance of $43.61/sf, the out-of-pocket cost for tenants is $152.88/sf, according to JLL’s new U.S. Fit Out Guide.
The report combines fitout costs and tenant improvement allowances to paint a comprehensive picture of what companies can expect to pay out of pocket for an office buildout across the nation. It also details the most- and least-expensive markets for fitouts.
Coming out on top as the most expensive market to build out an office is Silicon Valley, Calif., with an out-of-pocket cost of $199.22. The most affordable market: Washington, D.C., at $103.88.
“It’s no surprise that the Northwest continues to be the most expensive region for office builds,” says Mason Mularoni, Senior Research Analyst, JLL Project and Development Services. Southern cities claimed six out of the 10 most affordable markets.
Due to the range of landlord-provided tenant improvement packages, some cities that made the top lists were pretty unexpected.
 Silicon Valley, Calif., is the most expensive market for office fitout projects, with an average out-of-pocket cost of $199.22/sf, according to JLL.
Washington, D.C.: most affordable. Often topping most-expensive lists, the District of Columbia is officially the most inexpensive market to build out an office space. As the federal government, contractors, and law firms continue to consolidate, slightly below-average buildout costs are offset by record-high concession packages from landlords who are desperate to get tenants into the exploding mass of available space.
Detroit: eighth most expensive. Once on the brink of financial collapse, the Motor City is being reinvigorated by an eager tech community. Startups, investors, and outside firms are attracted to the Motor City’s resolve to bounce back.
But Detroit isn’t in the clear just yet. Due to above-average buildout costs and minimal TI packages, the city swings in as one of the top out-of-pocket cost markets.
Los Angeles: sixth most affordable market to build out an office. New leasing activity has been nourished by the convergence of media, technology, and entertainment. The tech sector in particular has shown a preference for creative buildouts. LA’s enormous TI packages are tied with Washington, D.C., for largest in the nation, offering an affordable option in the notoriously expensive state.
Long Island, N.Y.: third most expensive, beating out traditional frontrunner New York City. When it comes to building costs alone, New York City tops the list. But substantial TI packages in the city allow Long Island to slide ahead in out-of-pocket costs, holding its own against the expensive Northern California cities.
Seattle: seventh most affordable. Although the Northwest region tops the most expensive list, Seattle is the exception to the rule. Technology continues to be the primary factor of the city, and significant growth is occurring from local companies as well as from tenants migrating from the Bay Area.
The second-largest TI package average across the nation enables Seattle to hold down seventh place in most-affordable-city honors.
Related Stories
Market Data | Jun 21, 2018
Architecture firm billings strengthen in May
Architecture Billings Index enters eighth straight month of solid growth.

Market Data | Jun 20, 2018
7% year-over-year growth in the global construction pipeline
There are 5,952 projects/1,115,288 rooms under construction, up 8% by projects YOY.
Market Data | Jun 19, 2018
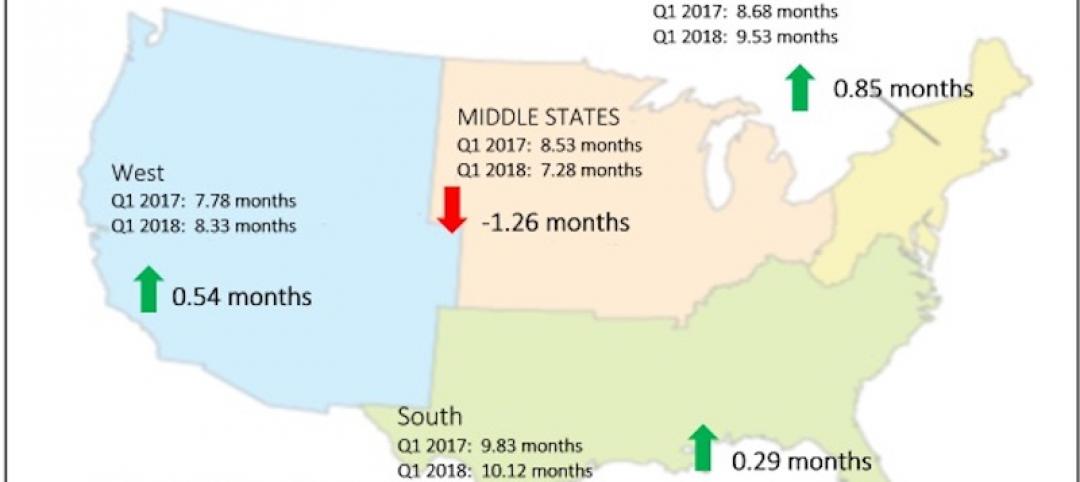
ABC’s Construction Backlog Indicator remains elevated in first quarter of 2018
The CBI shows highlights by region, industry, and company size.
Market Data | Jun 19, 2018
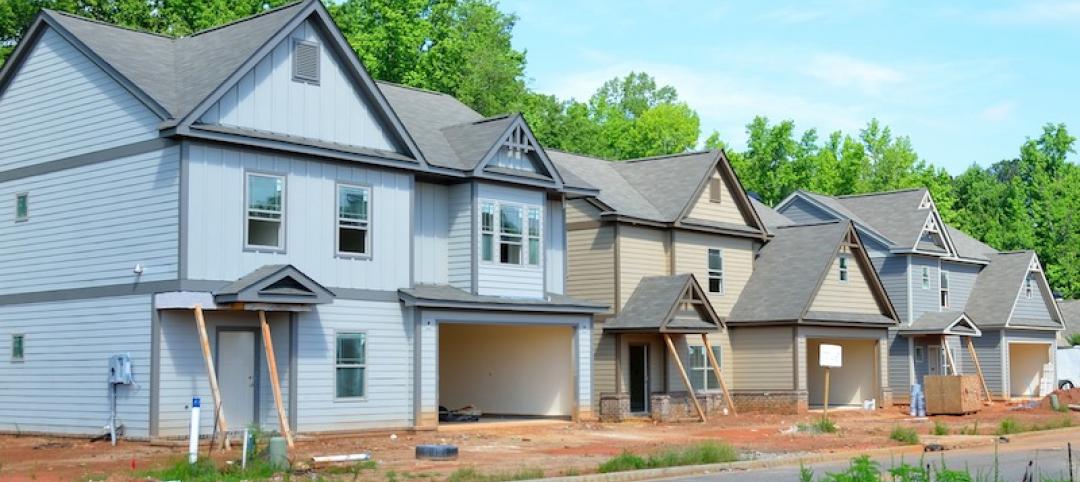
America’s housing market still falls short of providing affordable shelter to many
The latest report from the Joint Center for Housing Studies laments the paucity of subsidies to relieve cost burdens of ownership and renting.

Market Data | Jun 18, 2018
AI is the path to maximum profitability for retail and FMCG firms
Leading retailers including Amazon, Alibaba, Lowe’s and Tesco are developing their own AI solutions for automation, analytics and robotics use cases.

Market Data | Jun 12, 2018
Yardi Matrix report details industrial sector's strength
E-commerce and biopharmaceutical companies seeking space stoke record performances across key indicators.
Market Data | Jun 8, 2018
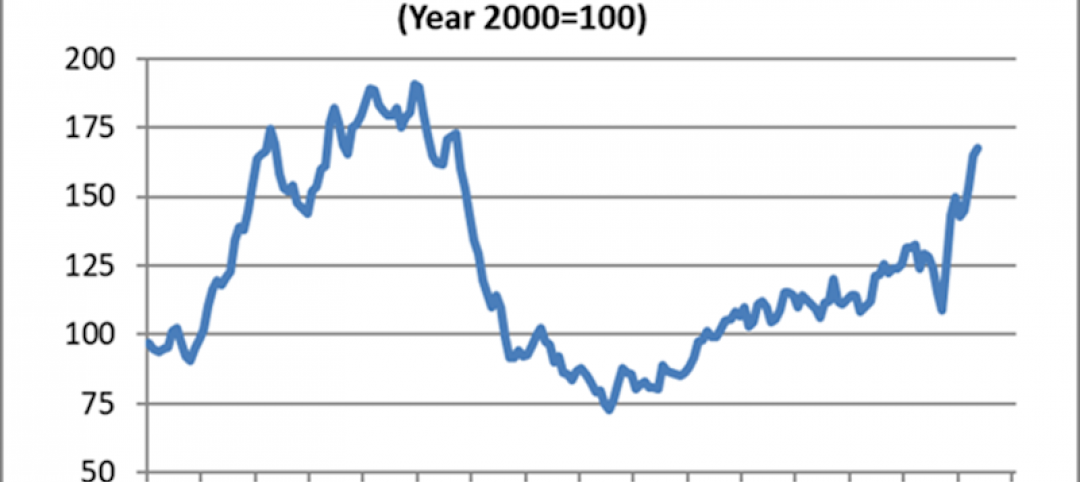
Dodge Momentum Index inches up in May
May’s gain was the result of a 4.7% increase by the commercial component of the Momentum Index.
Market Data | Jun 4, 2018
Nonresidential construction remains unchanged in April
Private sector spending increased 0.8% on a monthly basis and is up 5.3% from a year ago.
Market Data | May 30, 2018
Construction employment increases in 256 metro areas between April 2017 & 2018
Dallas-Plano-Irving and Midland, Texas experience largest year-over-year gains; St. Louis, Mo.-Ill. and Bloomington, Ill. have biggest annual declines in construction employment amid continuing demand.

Market Data | May 29, 2018
America’s fastest-growing cities: San Antonio, Phoenix lead population growth
San Antonio added 24,208 people between July 2016 and July 2017, according to U.S. Census Bureau data.


