

Nationally, the average cost to build out an office is $196.49/sf. But after taking into account the average landlord-provided tenant-improvement allowance of $43.61/sf, the out-of-pocket cost for tenants is $152.88/sf, according to JLL’s new U.S. Fit Out Guide.
The report combines fitout costs and tenant improvement allowances to paint a comprehensive picture of what companies can expect to pay out of pocket for an office buildout across the nation. It also details the most- and least-expensive markets for fitouts.
Coming out on top as the most expensive market to build out an office is Silicon Valley, Calif., with an out-of-pocket cost of $199.22. The most affordable market: Washington, D.C., at $103.88.
“It’s no surprise that the Northwest continues to be the most expensive region for office builds,” says Mason Mularoni, Senior Research Analyst, JLL Project and Development Services. Southern cities claimed six out of the 10 most affordable markets.
Due to the range of landlord-provided tenant improvement packages, some cities that made the top lists were pretty unexpected.
 Silicon Valley, Calif., is the most expensive market for office fitout projects, with an average out-of-pocket cost of $199.22/sf, according to JLL.
Washington, D.C.: most affordable. Often topping most-expensive lists, the District of Columbia is officially the most inexpensive market to build out an office space. As the federal government, contractors, and law firms continue to consolidate, slightly below-average buildout costs are offset by record-high concession packages from landlords who are desperate to get tenants into the exploding mass of available space.
Detroit: eighth most expensive. Once on the brink of financial collapse, the Motor City is being reinvigorated by an eager tech community. Startups, investors, and outside firms are attracted to the Motor City’s resolve to bounce back.
But Detroit isn’t in the clear just yet. Due to above-average buildout costs and minimal TI packages, the city swings in as one of the top out-of-pocket cost markets.
Los Angeles: sixth most affordable market to build out an office. New leasing activity has been nourished by the convergence of media, technology, and entertainment. The tech sector in particular has shown a preference for creative buildouts. LA’s enormous TI packages are tied with Washington, D.C., for largest in the nation, offering an affordable option in the notoriously expensive state.
Long Island, N.Y.: third most expensive, beating out traditional frontrunner New York City. When it comes to building costs alone, New York City tops the list. But substantial TI packages in the city allow Long Island to slide ahead in out-of-pocket costs, holding its own against the expensive Northern California cities.
Seattle: seventh most affordable. Although the Northwest region tops the most expensive list, Seattle is the exception to the rule. Technology continues to be the primary factor of the city, and significant growth is occurring from local companies as well as from tenants migrating from the Bay Area.
The second-largest TI package average across the nation enables Seattle to hold down seventh place in most-affordable-city honors.
Related Stories
Market Data | Jun 12, 2019
Construction input prices see slight increase in May
Among the 11 subcategories, six saw prices fall last month, with the largest decreases in natural gas.

Market Data | Jun 3, 2019
Nonresidential construction spending up 6.4% year over year in April
Among the 16 sectors tracked by the U.S. Census Bureau, nine experienced an increase in monthly spending, led by water supply and highway and street.

Market Data | Jun 3, 2019
4.1% annual growth in office asking rents above five-year compound annual growth rate
Market has experienced no change in office vacancy rates in three quarters.

Market Data | May 30, 2019
Construction employment increases in 250 out of 358 metros from April 2018 to April 2019
Demand for work is outpacing the supply of workers.
Market Data | May 24, 2019
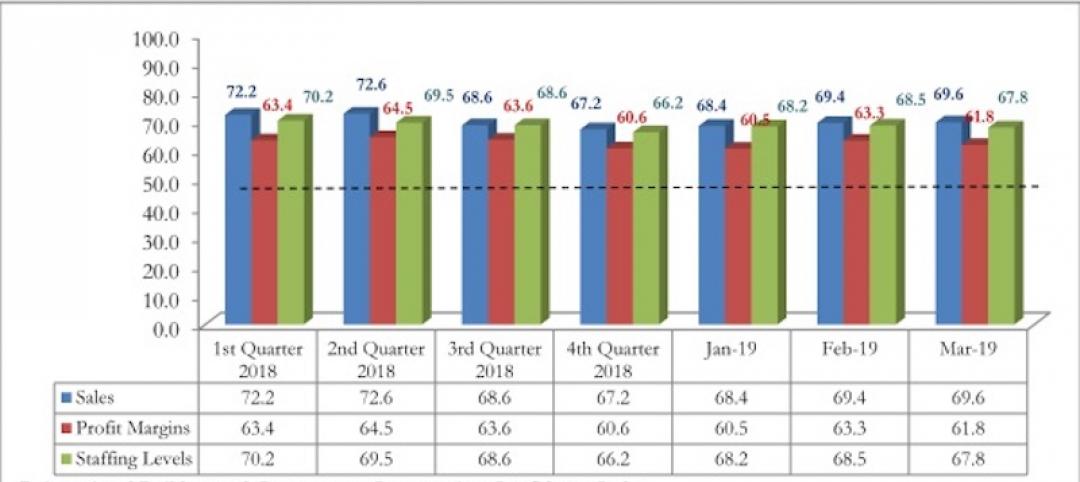
Construction contractors confidence remains high in March
More than 70% of contractors expect to increase staffing levels over the next six months.
Market Data | May 22, 2019
Slight rebound for architecture billings in April
AIA’s ABI score for April showed a small increase in design services at 50.5 in April.
Market Data | May 9, 2019
The U.S. hotel construction pipeline continues to grow in the first quarter as the economy shows surprising strength
Projects currently under construction stand at 1,709 projects/227,924 rooms.
Market Data | May 9, 2019
Construction input prices continue to rise
Nonresidential input prices rose 0.9% compared to March and are up 2.8% on an annual basis.
Market Data | May 7, 2019
Construction costs in major metros continued to climb last year
Latest Rider Levett Bucknall report estimates rise at more than double the rate of 2018 Growth Domestic Product.
Market Data | Apr 29, 2019
U.S. economic growth crosses 3% threshold to begin the year
Growth was fueled by myriad factors, including personal consumption expenditures, private inventory investment, surprisingly rapid growth in exports, state and local government spending and intellectual property.


