


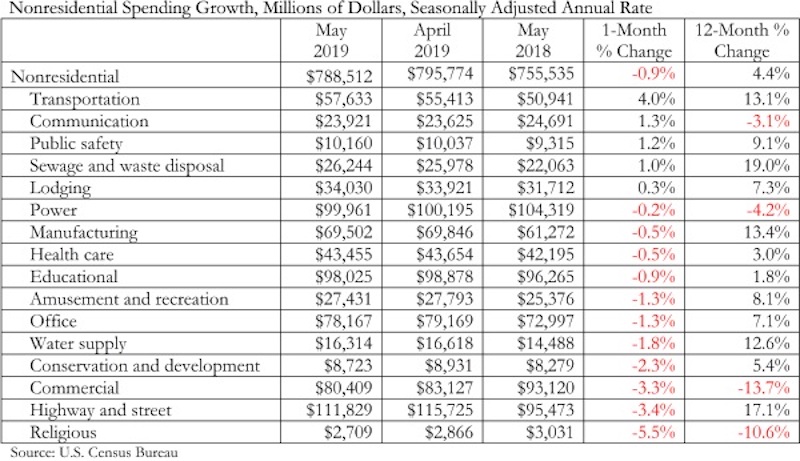
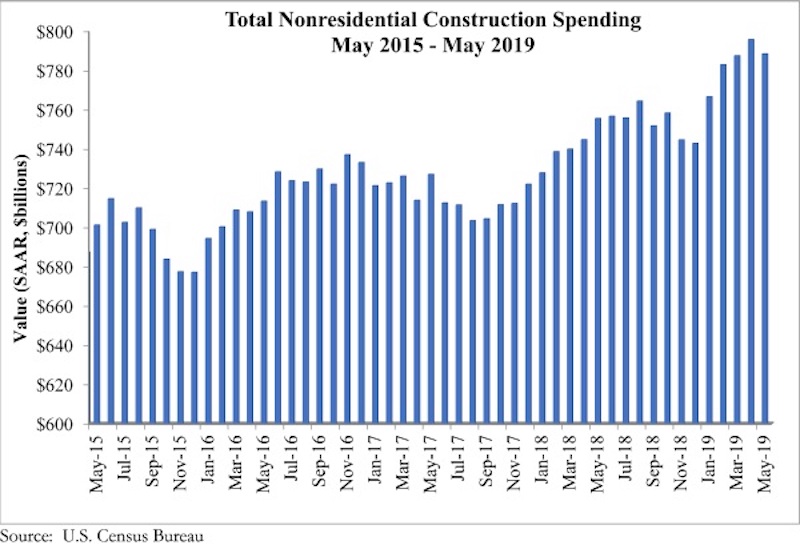
According to an Associated Builders and Contractors analysis of U.S. Census Bureau data published today, national nonresidential construction spending declined 0.9% in May, totaling $788.5 billion on a seasonally adjusted annualized basis and a 4.4% increase compared to the same time last year. While total public and private nonresidential spending declined 0.9% since April, public spending was up 11.2% and private spending was down 0.1% year over year.
Among the 16 nonresidential construction spending categories tracked by the Census Bureau, five experienced increases in monthly spending, including transportation (4%), communication (1.3%) and public safety (1.2%). Religious (-5.5%), commercial (-3.3%) and highway and street (-3.4%) experienced the largest monthly decreases, although highway and street spending remained up 17.1% compared to May 2018. Total construction spending is down 2.3% compared to the same time last year, and residential spending is down sharply.
“Private construction spending has been slipping for several months,” said ABC Chief Economist Anirban Basu. “Commercial construction spending decreased nearly 14% during the past year, which represents a stark reversal from previous trends when America’s consumer-spending-led expansion produced substantial demand for commercial construction. That said, commercial spending is up 102% compared to May 2010. Other private construction categories such as office and lodging have also been weak as rising construction and capital costs render pro formas more problematic. There are also growing concerns regarding overbuilding in certain segments/markets.
“What was different about today’s release was the decline in public construction spending,” said Basu. “While the drop was reasonably small on a monthly basis, it stands in stark contrast to the preexisting trend. With the economic expansion entering its record 11th year, state and local government finances are generally in good shape, leaving more money to spend on infrastructure. Based on broad economic dynamics and fiscal considerations, there is little reason to believe that the dip in May portends a slowdown in infrastructure spending during the months ahead.”
Related Stories

Market Data | Oct 31, 2016
Nonresidential fixed investment expands again during solid third quarter
The acceleration in real GDP growth was driven by a combination of factors, including an upturn in exports, a smaller decrease in state and local government spending and an upturn in federal government spending, says ABC Chief Economist Anirban Basu.

Market Data | Oct 28, 2016
U.S. construction solid and stable in Q3 of 2016; Presidential election seen as influence on industry for 2017
Rider Levett Bucknall’s Third Quarter 2016 USA Construction Cost Report puts the complete spectrum of construction sectors and markets in perspective as it assesses the current state of the industry.

Industry Research | Oct 25, 2016
New HOK/CoreNet Global report explores impact of coworking on corporate real rstate
“Although coworking space makes up less than one percent of the world’s office space, it represents an important workforce trend and highlights the strong desire of today’s employees to have workplace choices, community and flexibility,” says Kay Sargent, Director of WorkPlace at HOK.

Market Data | Oct 24, 2016
New construction starts in 2017 to increase 5% to $713 billion
Dodge Outlook Report predicts moderate growth for most project types – single family housing, commercial and institutional building, and public works, while multifamily housing levels off and electric utilities/gas plants decline.

High-rise Construction | Oct 21, 2016
The world’s 100 tallest buildings: Which architects have designed the most?
Two firms stand well above the others when it comes to the number of tall buildings they have designed.

Market Data | Oct 19, 2016
Architecture Billings Index slips consecutive months for first time since 2012
“This recent backslide should act as a warning signal,” said AIA Chief Economist, Kermit Baker.

Market Data | Oct 11, 2016
Building design revenue topped $28 billion in 2015
Growing profitability at architecture firms has led to reinvestment and expansion

Market Data | Oct 4, 2016
Nonresidential spending slips in August
Public sector spending is declining faster than the private sector.

Industry Research | Oct 3, 2016
Structure Tone survey shows cost is still a major barrier to building green
Climate change, resilience and wellness are also growing concerns.

Industry Research | Sep 27, 2016
Sterling Risk Sentiment Index indicates risk exposure perception remains stable in construction industry
Nearly half (45%) of those polled say election year uncertainty has a negative effect on risk perception in the construction market.


