


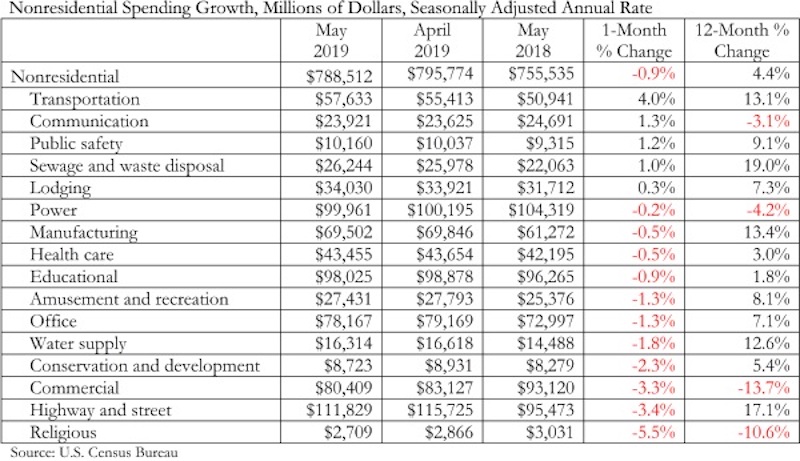
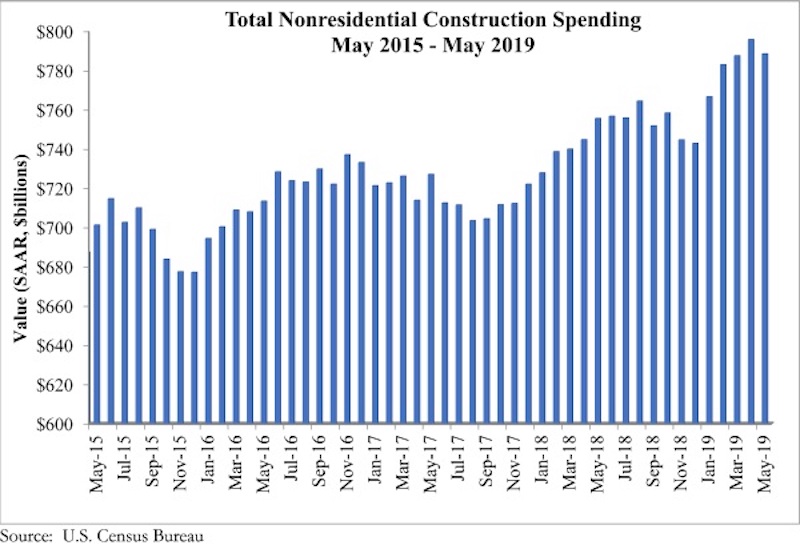
According to an Associated Builders and Contractors analysis of U.S. Census Bureau data published today, national nonresidential construction spending declined 0.9% in May, totaling $788.5 billion on a seasonally adjusted annualized basis and a 4.4% increase compared to the same time last year. While total public and private nonresidential spending declined 0.9% since April, public spending was up 11.2% and private spending was down 0.1% year over year.
Among the 16 nonresidential construction spending categories tracked by the Census Bureau, five experienced increases in monthly spending, including transportation (4%), communication (1.3%) and public safety (1.2%). Religious (-5.5%), commercial (-3.3%) and highway and street (-3.4%) experienced the largest monthly decreases, although highway and street spending remained up 17.1% compared to May 2018. Total construction spending is down 2.3% compared to the same time last year, and residential spending is down sharply.
“Private construction spending has been slipping for several months,” said ABC Chief Economist Anirban Basu. “Commercial construction spending decreased nearly 14% during the past year, which represents a stark reversal from previous trends when America’s consumer-spending-led expansion produced substantial demand for commercial construction. That said, commercial spending is up 102% compared to May 2010. Other private construction categories such as office and lodging have also been weak as rising construction and capital costs render pro formas more problematic. There are also growing concerns regarding overbuilding in certain segments/markets.
“What was different about today’s release was the decline in public construction spending,” said Basu. “While the drop was reasonably small on a monthly basis, it stands in stark contrast to the preexisting trend. With the economic expansion entering its record 11th year, state and local government finances are generally in good shape, leaving more money to spend on infrastructure. Based on broad economic dynamics and fiscal considerations, there is little reason to believe that the dip in May portends a slowdown in infrastructure spending during the months ahead.”
Related Stories

Market Data | Jan 5, 2016
Nonresidential construction spending falters in November
Only 4 of 16 subsectors showed gains

Market Data | Dec 15, 2015
AIA: Architecture Billings Index hits another bump
Business conditions show continued strength in South and West regions.

Market Data | Dec 7, 2015
2016 forecast: Continued growth expected for the construction industry
ABC forecasts growth in nonresidential construction spending of 7.4% in 2016 along with growth in employment and backlog.


