


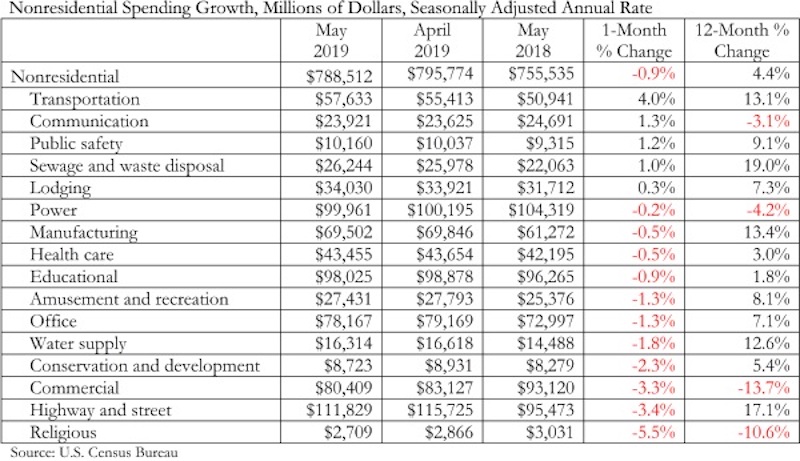
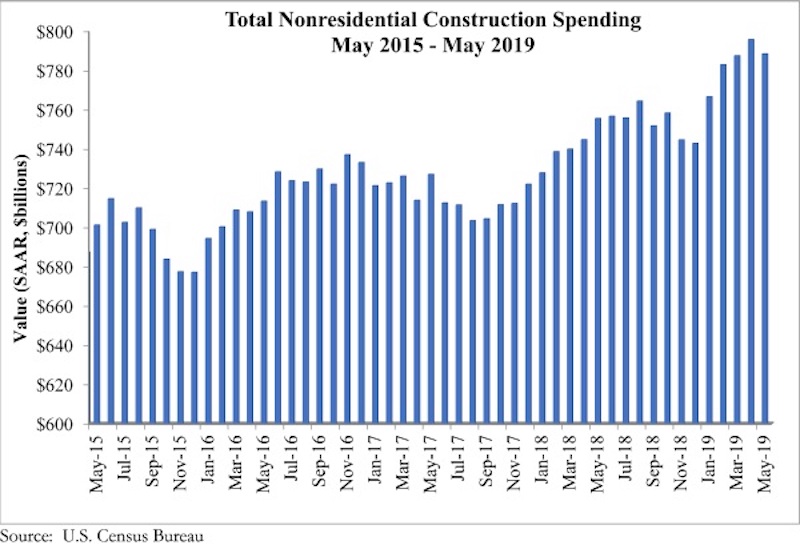
According to an Associated Builders and Contractors analysis of U.S. Census Bureau data published today, national nonresidential construction spending declined 0.9% in May, totaling $788.5 billion on a seasonally adjusted annualized basis and a 4.4% increase compared to the same time last year. While total public and private nonresidential spending declined 0.9% since April, public spending was up 11.2% and private spending was down 0.1% year over year.
Among the 16 nonresidential construction spending categories tracked by the Census Bureau, five experienced increases in monthly spending, including transportation (4%), communication (1.3%) and public safety (1.2%). Religious (-5.5%), commercial (-3.3%) and highway and street (-3.4%) experienced the largest monthly decreases, although highway and street spending remained up 17.1% compared to May 2018. Total construction spending is down 2.3% compared to the same time last year, and residential spending is down sharply.
“Private construction spending has been slipping for several months,” said ABC Chief Economist Anirban Basu. “Commercial construction spending decreased nearly 14% during the past year, which represents a stark reversal from previous trends when America’s consumer-spending-led expansion produced substantial demand for commercial construction. That said, commercial spending is up 102% compared to May 2010. Other private construction categories such as office and lodging have also been weak as rising construction and capital costs render pro formas more problematic. There are also growing concerns regarding overbuilding in certain segments/markets.
“What was different about today’s release was the decline in public construction spending,” said Basu. “While the drop was reasonably small on a monthly basis, it stands in stark contrast to the preexisting trend. With the economic expansion entering its record 11th year, state and local government finances are generally in good shape, leaving more money to spend on infrastructure. Based on broad economic dynamics and fiscal considerations, there is little reason to believe that the dip in May portends a slowdown in infrastructure spending during the months ahead.”
Related Stories

Market Data | Mar 29, 2017
Contractor confidence ends 2016 down but still in positive territory
Although all three diffusion indices in the survey fell by more than five points they remain well above the threshold of 50, which signals that construction activity will continue to be one of the few significant drivers of economic growth.

Market Data | Mar 24, 2017
These are the most and least innovative states for 2017
Connecticut, Virginia, and Maryland are all in the top 10 most innovative states, but none of them were able to claim the number one spot.

Market Data | Mar 22, 2017
After a strong year, construction industry anxious about Washington’s proposed policy shifts
Impacts on labor and materials costs at issue, according to latest JLL report.

Market Data | Mar 22, 2017
Architecture Billings Index rebounds into positive territory
Business conditions projected to solidify moving into the spring and summer.

Market Data | Mar 15, 2017
ABC's Construction Backlog Indicator fell to end 2016
Contractors in each segment surveyed all saw lower backlog during the fourth quarter, with firms in the heavy industrial segment experiencing the largest drop.

Market Data | Feb 28, 2017
Leopardo’s 2017 Construction Economics Report shows year-over-year construction spending increase of 4.2%
The pace of growth was slower than in 2015, however.

Market Data | Feb 23, 2017
Entering 2017, architecture billings slip modestly
Despite minor slowdown in overall billings, commercial/ industrial and institutional sectors post strongest gains in over 12 months.

Market Data | Feb 16, 2017
How does your hospital stack up? Grumman/Butkus Associates 2016 Hospital Benchmarking Survey
Report examines electricity, fossil fuel, water/sewer, and carbon footprint.

Market Data | Feb 1, 2017
Nonresidential spending falters slightly to end 2016
Nonresidential spending decreased from $713.1 billion in November to $708.2 billion in December.

Market Data | Jan 31, 2017
AIA foresees nonres building spending increasing, but at a slower pace than in 2016
Expects another double-digit growth year for office construction, but a more modest uptick for health-related building.


