

Construction employment declined or stagnated in 101 metro areas between February 2020, the last month before the pandemic, and last month, according to an analysis by the Associated General Contractors of America of government employment data released today. Association officials said that labor shortages and supply chain problems were keeping many firms from adding workers in many parts of the country.
“Typically, construction employment increases between February and June in all but 30 metro areas,” said Ken Simonson, the association’s chief economist. “The fact that more than three times as many metros as usual failed to add construction jobs, despite a hot housing market, is an indication of the continuing impact of the pandemic on both demand for nonresidential projects and the supply of workers.”
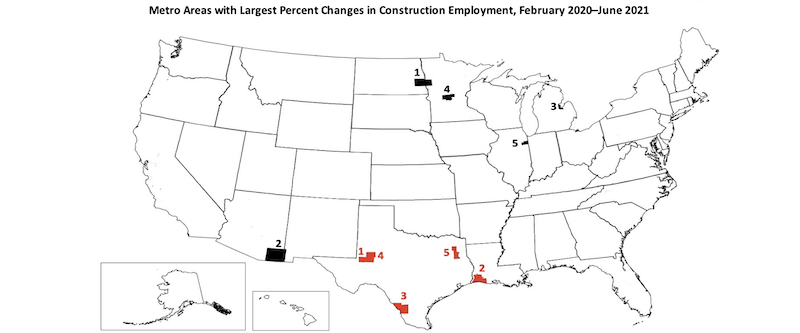
Eighty metro areas had lower construction employment in June 2021 than February 2020, while industry employment was unchanged in 21 areas. Houston-The Woodlands-Sugar Land, Texas lost the most jobs: 33,400 or 14%. Major losses also occurred in New York City (-22,000 jobs, -14%); Midland, Texas (-9,300 jobs, -24%); Odessa, Texas (-7,900 jobs, -38%) and Baton Rouge, La. (-7,700 jobs, -16%). Odessa had the largest percentage decline, followed by Lake Charles, La. (-34%, -6,700 jobs); Laredo, Texas (-25%, -1,000 jobs); Midland; and Longview, Texas (-22%, -3,300 jobs).
Of the 257 metro areas—72%—added construction jobs over the February 2020 level, Chicago-Naperville-Arlington Heights, Ill. added the most construction jobs over 16 months (14,300 jobs, 12%), followed by Minneapolis-St. Paul-Bloomington, Minn.-Wis. (13,800 jobs, 18%); Indianapolis-Carmel-Anderson, Ind. (10,700 jobs, 20%); Warren-Troy-Farmington Hills, Mich. (9,300 jobs, 18%); and Pittsburgh, Pa. (7,600 jobs, 13%). Fargo, N.D.-Minn. had the highest percentage increase (50%, 3,700 jobs), followed by Sierra Vista-Douglas, Ariz. (48%, 1,200 jobs); Bay City, Mich. (45%, 500 jobs); St. Cloud, Minn. (39%, 2,400 jobs) and Kankakee, Ill. (36%, 400 jobs).
Association officials urged Congress and the Biden administration to make new investments in workforce development and to take steps to address supply chain issues. “They called for additional funding for career and technical education; they noted that craft training receives only one-sixth as much federal funding as college preparation.” They also continued to call on the president to remove tariffs on key construction materials like steel and aluminum.
“Federal officials may talk about the value of craft careers like construction, but they are failing to put their money where their mouth is,” said Stephen E. Sandherr, the association’s chief executive officer. “Until we expose more people to construction careers, and get a handle on soaring materials prices, the construction industry is likely to have a hard time recovering from the pandemic.”
Related Stories

Industry Research | Jul 6, 2017
The four types of strategic real estate amenities
From swimming pools to pirate ships, amenities (even crazy ones) aren’t just perks, but assets to enhance performance.
Market Data | Jun 29, 2017
Silicon Valley, Long Island among the priciest places for office fitouts
Coming out on top as the most expensive market to build out an office is Silicon Valley, Calif., with an out-of-pocket cost of $199.22.

Market Data | Jun 26, 2017
Construction disputes were slightly less contentious last year
But poorly written and administered contracts are still problems, says latest Arcadis report.

Industry Research | Jun 26, 2017
Time to earn an architecture license continues to drop
This trend is driven by candidates completing the experience and examination programs concurrently and more quickly.

Industry Research | Jun 22, 2017
ABC's Construction Backlog Indicator rebounds in 2017
The first quarter showed gains in all categories.

Market Data | Jun 21, 2017
Design billings maintain solid footing, strong momentum reflected in project inquiries/design contracts
Balanced growth results in billings gains in all sectors.

Market Data | Jun 16, 2017
Residential construction was strong, but not enough, in 2016
The Joint Center for Housing Studies’ latest report expects minorities and millennials to account for the lion’s share of household formations through 2035.

Industry Research | Jun 15, 2017
Commercial Construction Index indicates high revenue and employment expectations for 2017
USG Corporation (USG) and U.S. Chamber of Commerce release survey results gauging confidence among industry leaders.

Market Data | Jun 2, 2017
Nonresidential construction spending falls in 13 of 16 segments in April
Nonresidential construction spending fell 1.7% in April 2017, totaling $696.3 billion on a seasonally adjusted, annualized basis, according to analysis of U.S. Census Bureau data released today by Associated Builders and Contractors.

Industry Research | May 25, 2017
Project labor agreement mandates inflate cost of construction 13%
Ohio schools built under government-mandated project labor agreements (PLAs) cost 13.12 percent more than schools that were bid and constructed through fair and open competition.


