

Construction employment declined or stagnated in 101 metro areas between February 2020, the last month before the pandemic, and last month, according to an analysis by the Associated General Contractors of America of government employment data released today. Association officials said that labor shortages and supply chain problems were keeping many firms from adding workers in many parts of the country.
“Typically, construction employment increases between February and June in all but 30 metro areas,” said Ken Simonson, the association’s chief economist. “The fact that more than three times as many metros as usual failed to add construction jobs, despite a hot housing market, is an indication of the continuing impact of the pandemic on both demand for nonresidential projects and the supply of workers.”
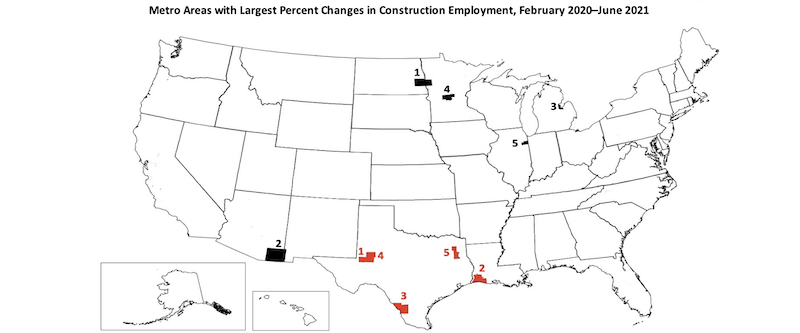
Eighty metro areas had lower construction employment in June 2021 than February 2020, while industry employment was unchanged in 21 areas. Houston-The Woodlands-Sugar Land, Texas lost the most jobs: 33,400 or 14%. Major losses also occurred in New York City (-22,000 jobs, -14%); Midland, Texas (-9,300 jobs, -24%); Odessa, Texas (-7,900 jobs, -38%) and Baton Rouge, La. (-7,700 jobs, -16%). Odessa had the largest percentage decline, followed by Lake Charles, La. (-34%, -6,700 jobs); Laredo, Texas (-25%, -1,000 jobs); Midland; and Longview, Texas (-22%, -3,300 jobs).
Of the 257 metro areas—72%—added construction jobs over the February 2020 level, Chicago-Naperville-Arlington Heights, Ill. added the most construction jobs over 16 months (14,300 jobs, 12%), followed by Minneapolis-St. Paul-Bloomington, Minn.-Wis. (13,800 jobs, 18%); Indianapolis-Carmel-Anderson, Ind. (10,700 jobs, 20%); Warren-Troy-Farmington Hills, Mich. (9,300 jobs, 18%); and Pittsburgh, Pa. (7,600 jobs, 13%). Fargo, N.D.-Minn. had the highest percentage increase (50%, 3,700 jobs), followed by Sierra Vista-Douglas, Ariz. (48%, 1,200 jobs); Bay City, Mich. (45%, 500 jobs); St. Cloud, Minn. (39%, 2,400 jobs) and Kankakee, Ill. (36%, 400 jobs).
Association officials urged Congress and the Biden administration to make new investments in workforce development and to take steps to address supply chain issues. “They called for additional funding for career and technical education; they noted that craft training receives only one-sixth as much federal funding as college preparation.” They also continued to call on the president to remove tariffs on key construction materials like steel and aluminum.
“Federal officials may talk about the value of craft careers like construction, but they are failing to put their money where their mouth is,” said Stephen E. Sandherr, the association’s chief executive officer. “Until we expose more people to construction careers, and get a handle on soaring materials prices, the construction industry is likely to have a hard time recovering from the pandemic.”
Related Stories

Industry Research | Apr 28, 2017
A/E Industry lacks planning, but still spending large on hiring
The average 200-person A/E Firm is spending $200,000 on hiring, and not budgeting at all.

Market Data | Apr 19, 2017
Architecture Billings Index continues to strengthen
Balanced growth results in billings gains in all regions.

Market Data | Apr 13, 2017
2016’s top 10 states for commercial development
Three new states creep into the top 10 while first and second place remain unchanged.

Market Data | Apr 6, 2017
Architecture marketing: 5 tools to measure success
We’ve identified five architecture marketing tools that will help your firm evaluate if it’s on the track to more leads, higher growth, and broader brand visibility.

Market Data | Apr 3, 2017
Public nonresidential construction spending rebounds; overall spending unchanged in February
The segment totaled $701.9 billion on a seasonally adjusted annualized rate for the month, marking the seventh consecutive month in which nonresidential spending sat above the $700 billion threshold.

Market Data | Mar 29, 2017
Contractor confidence ends 2016 down but still in positive territory
Although all three diffusion indices in the survey fell by more than five points they remain well above the threshold of 50, which signals that construction activity will continue to be one of the few significant drivers of economic growth.

Market Data | Mar 24, 2017
These are the most and least innovative states for 2017
Connecticut, Virginia, and Maryland are all in the top 10 most innovative states, but none of them were able to claim the number one spot.

Market Data | Mar 22, 2017
After a strong year, construction industry anxious about Washington’s proposed policy shifts
Impacts on labor and materials costs at issue, according to latest JLL report.

Market Data | Mar 22, 2017
Architecture Billings Index rebounds into positive territory
Business conditions projected to solidify moving into the spring and summer.

Market Data | Mar 15, 2017
ABC's Construction Backlog Indicator fell to end 2016
Contractors in each segment surveyed all saw lower backlog during the fourth quarter, with firms in the heavy industrial segment experiencing the largest drop.


