

Construction employment declined or stagnated in 101 metro areas between February 2020, the last month before the pandemic, and last month, according to an analysis by the Associated General Contractors of America of government employment data released today. Association officials said that labor shortages and supply chain problems were keeping many firms from adding workers in many parts of the country.
“Typically, construction employment increases between February and June in all but 30 metro areas,” said Ken Simonson, the association’s chief economist. “The fact that more than three times as many metros as usual failed to add construction jobs, despite a hot housing market, is an indication of the continuing impact of the pandemic on both demand for nonresidential projects and the supply of workers.”
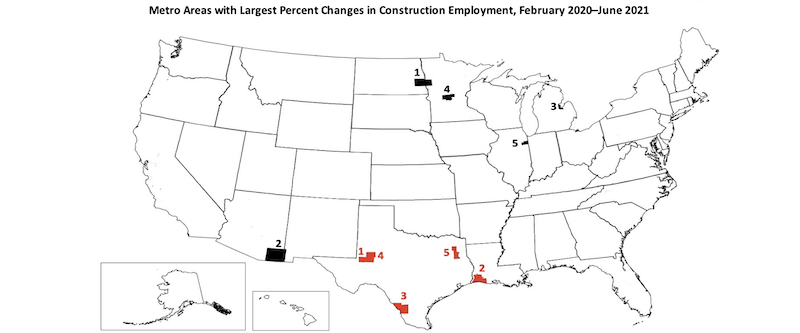
Eighty metro areas had lower construction employment in June 2021 than February 2020, while industry employment was unchanged in 21 areas. Houston-The Woodlands-Sugar Land, Texas lost the most jobs: 33,400 or 14%. Major losses also occurred in New York City (-22,000 jobs, -14%); Midland, Texas (-9,300 jobs, -24%); Odessa, Texas (-7,900 jobs, -38%) and Baton Rouge, La. (-7,700 jobs, -16%). Odessa had the largest percentage decline, followed by Lake Charles, La. (-34%, -6,700 jobs); Laredo, Texas (-25%, -1,000 jobs); Midland; and Longview, Texas (-22%, -3,300 jobs).
Of the 257 metro areas—72%—added construction jobs over the February 2020 level, Chicago-Naperville-Arlington Heights, Ill. added the most construction jobs over 16 months (14,300 jobs, 12%), followed by Minneapolis-St. Paul-Bloomington, Minn.-Wis. (13,800 jobs, 18%); Indianapolis-Carmel-Anderson, Ind. (10,700 jobs, 20%); Warren-Troy-Farmington Hills, Mich. (9,300 jobs, 18%); and Pittsburgh, Pa. (7,600 jobs, 13%). Fargo, N.D.-Minn. had the highest percentage increase (50%, 3,700 jobs), followed by Sierra Vista-Douglas, Ariz. (48%, 1,200 jobs); Bay City, Mich. (45%, 500 jobs); St. Cloud, Minn. (39%, 2,400 jobs) and Kankakee, Ill. (36%, 400 jobs).
Association officials urged Congress and the Biden administration to make new investments in workforce development and to take steps to address supply chain issues. “They called for additional funding for career and technical education; they noted that craft training receives only one-sixth as much federal funding as college preparation.” They also continued to call on the president to remove tariffs on key construction materials like steel and aluminum.
“Federal officials may talk about the value of craft careers like construction, but they are failing to put their money where their mouth is,” said Stephen E. Sandherr, the association’s chief executive officer. “Until we expose more people to construction careers, and get a handle on soaring materials prices, the construction industry is likely to have a hard time recovering from the pandemic.”
Related Stories

Industry Research | Jan 30, 2018
AIA’s Kermit Baker: Five signs of an impending upturn in construction spending
Tax reform implications and rebuilding from natural disasters are among the reasons AIA’s Chief Economist is optimistic for 2018 and 2019.

Market Data | Jan 30, 2018
AIA Consensus Forecast: 4.0% growth for nonresidential construction spending in 2018
The commercial office and retail sectors will lead the way in 2018, with a strong bounce back for education and healthcare.

Market Data | Jan 29, 2018
Year-end data show economy expanded in 2017; Fixed investment surged in fourth quarter
The economy expanded at an annual rate of 2.6% during the fourth quarter of 2017.

Market Data | Jan 25, 2018
Renters are the majority in 42 U.S. cities
Over the past 10 years, the number of renters has increased by 23 million.

Market Data | Jan 24, 2018
HomeUnion names the most and least affordable rental housing markets
Chicago tops the list as the most affordable U.S. metro, while Oakland, Calif., is the most expensive rental market.

Market Data | Jan 12, 2018
Construction input prices inch down in December, Up YOY despite low inflation
Energy prices have been more volatile lately.

Market Data | Jan 4, 2018
Nonresidential construction spending ticks higher in November, down year-over-year
Despite the month-over-month expansion, nonresidential spending fell 1.3 percent from November 2016.

Contractors | Jan 4, 2018
Construction spending in a ‘mature’ period of incremental growth
Labor shortages are spiking wages. Materials costs are rising, too.
 reported the November ABI score was 55.0, up from a score of 51.7 in the previous month. Photo: Pixabay")
Market Data | Dec 20, 2017
Architecture billings upturn shows broad strength
The American Institute of Architects (AIA) reported the November ABI score was 55.0, up from a score of 51.7 in the previous month.

Market Data | Dec 14, 2017
ABC chief economist predicts stable 2018 construction economy
There are risks to the 2018 outlook as a number of potential cost increases could come into play.


