

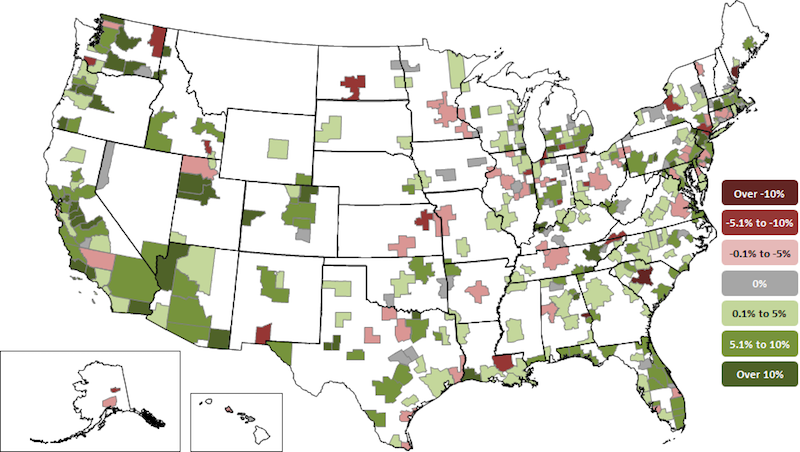
Construction employment increased in 256 out of 358 metro areas between April 2017 and April 2018, declined in 63 and was unchanged in 39, according to a new analysis of federal employment data released today by the Associated General Contractors of America. Association officials said that the data showed a continuation of strong labor demand amid shortages of qualified workers.
"Industry demand is still showing strength, as construction employment reached a new high in 54 metro areas," said Ken Simonson, the association's chief economist. "However, despite these signs, further growth in the industry may increasingly be stymied by a lack of qualified workers."
Dallas-Plano-Irving, Texas added the most construction jobs during the past year (12,400 jobs, 9%), followed by Houston-The Woodlands-Sugar Land, Texas (12,200 jobs, 6%); Phoenix-Mesa-Scottsdale, Ariz. (11,000 jobs, 10%); Midland, Texas (8,000 jobs, 31%) and Las Vegas-Henderson-Paradise, Nevada (7,700 jobs, 13%). The largest percentage gains occurred in the Midland, Texas metro area, followed by Merced, Calif. (29%, 700 jobs); New Bedford, Mass. (20%, 500 jobs); Atlantic City-Hammonton, N.J. (19%, 1,000 jobs) and Weirton-Steubenville, W.Va.-Ohio (19%, 300 jobs).
The largest job losses from April 2017 to April 2018 were in St. Louis, Mo.-Ill. (-3,100 jobs, -5%), followed by Middlesex-Monmouth-Ocean, N.J. (-2,900 jobs, -7%); Montgomery County-Bucks County-Chester County, Penn. (-2,800 jobs, -5%); Minneapolis-St. Paul-Bloomington, Minn.-Wis. (-2,400 jobs, -3%) and Columbia, S.C. (-2,200 jobs, -11%). The largest percentage decreases for the year were in Bloomington, Ill. (-16%, -500 jobs), followed by Bismarck, N.D. (-15%, -800 jobs), Auburn-Opelika, Ala. (-14%, -400 jobs); Battle Creek, Mich. (-12%, -200 jobs); and Columbia, S.C.
Association officials said that despite these widespread employment increases, many contractors report difficulty in finding qualified workers. With the national unemployment rate at a 17-year low and many metro unemployment rates at new record lows for April, finding workers is not expected to get easier in the near future. They added that education and training initiatives are the best way to increase the pool of skilled workers, creating a new generation of carpenters, electricians, and others, while giving Americans access to highly rewarding work.
"The good news is that the strong economy is driving demand for many types of construction projects," said Stephen E. Sandherr, the association's chief executive officer. "All that economic activity means that there are fewer, qualified, workers available for construction firms to hire to keep pace with demand."
Related Stories

Market Data | Sep 22, 2016
Architecture Billings Index slips, overall outlook remains positive
Business conditions are slumping in the Northeast.
Market Data | Sep 20, 2016
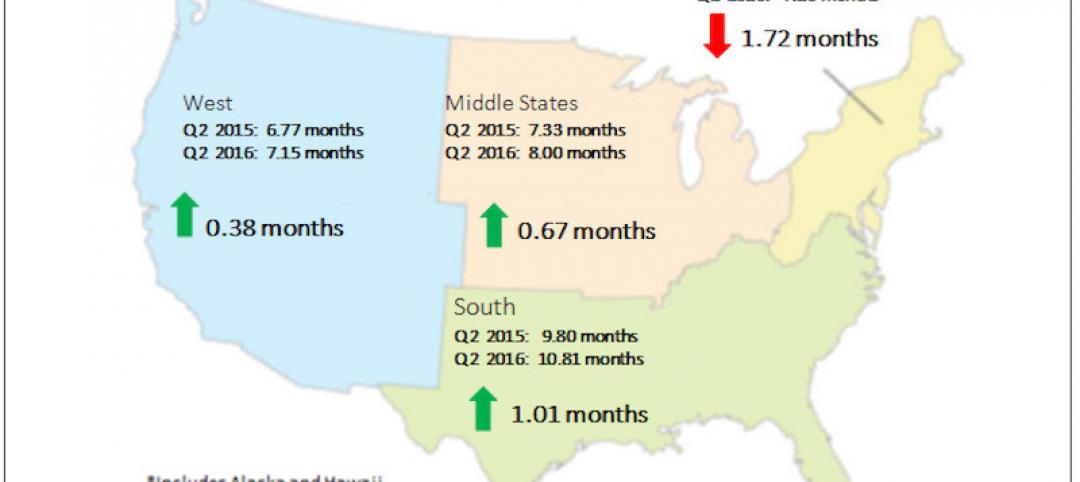
Backlog skyrockets for largest firms during second quarter, but falls to 8.5 months overall
While a handful of commercial construction segments continue to be associated with expanding volumes, for the most part, the average contractor is no longer getting busier, says ABC Chief Economist Anirban Basu.

Designers | Sep 13, 2016
5 trends propelling a new era of food halls
Food halls have not only become an economical solution for restauranteurs and chefs experiencing skyrocketing retail prices and rents in large cities, but they also tap into our increased interest in gourmet locally sourced food, writes Gensler's Toshi Kasai.

Building Team | Sep 6, 2016
Letting your resource take center stage: A guide to thoughtful site selection for interpretive centers
Thoughtful site selection is never about one factor, but rather a confluence of several components that ultimately present trade-offs for the owner.
Market Data | Sep 2, 2016
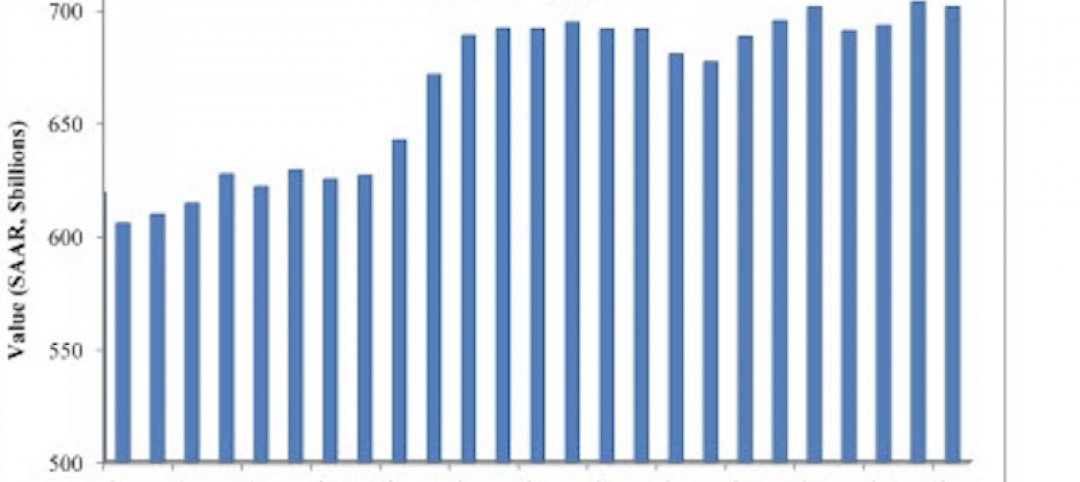
Nonresidential spending inches lower in July while June data is upwardly revised to eight-year record
Nonresidential construction spending has been suppressed over the last year or so with the primary factor being the lack of momentum in public spending.

Industry Research | Sep 1, 2016
CannonDesign releases infographic to better help universities obtain more R&D funding
CannonDesign releases infographic to better help universities obtain more R&D funding.

Industry Research | Aug 25, 2016
Building bonds: The role of 'trusted advisor' is earned not acquired
A trusted advisor acts as a guiding partner over the full course of a professional relationship.

Multifamily Housing | Aug 17, 2016
A new research platform launches for a data-deprived multifamily sector
The list of leading developers, owners, and property managers that are funding the NMHC Research Foundation speaks to the information gap it hopes to fill.

Hotel Facilities | Aug 17, 2016
Hotel construction continues to flourish in major cities
But concerns about overbuilding persist.

Market Data | Aug 16, 2016
Leading economists predict construction industry growth through 2017
The Chief Economists for ABC, AIA, and NAHB all see the construction industry continuing to expand over the next year and a half.


