

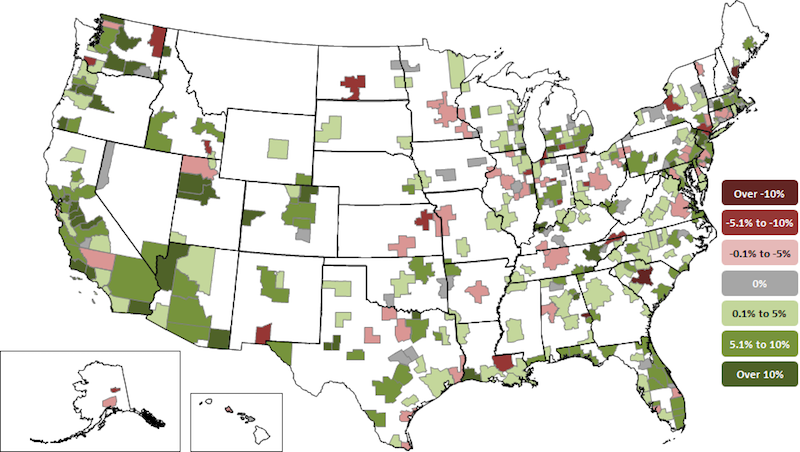
Construction employment increased in 256 out of 358 metro areas between April 2017 and April 2018, declined in 63 and was unchanged in 39, according to a new analysis of federal employment data released today by the Associated General Contractors of America. Association officials said that the data showed a continuation of strong labor demand amid shortages of qualified workers.
"Industry demand is still showing strength, as construction employment reached a new high in 54 metro areas," said Ken Simonson, the association's chief economist. "However, despite these signs, further growth in the industry may increasingly be stymied by a lack of qualified workers."
Dallas-Plano-Irving, Texas added the most construction jobs during the past year (12,400 jobs, 9%), followed by Houston-The Woodlands-Sugar Land, Texas (12,200 jobs, 6%); Phoenix-Mesa-Scottsdale, Ariz. (11,000 jobs, 10%); Midland, Texas (8,000 jobs, 31%) and Las Vegas-Henderson-Paradise, Nevada (7,700 jobs, 13%). The largest percentage gains occurred in the Midland, Texas metro area, followed by Merced, Calif. (29%, 700 jobs); New Bedford, Mass. (20%, 500 jobs); Atlantic City-Hammonton, N.J. (19%, 1,000 jobs) and Weirton-Steubenville, W.Va.-Ohio (19%, 300 jobs).
The largest job losses from April 2017 to April 2018 were in St. Louis, Mo.-Ill. (-3,100 jobs, -5%), followed by Middlesex-Monmouth-Ocean, N.J. (-2,900 jobs, -7%); Montgomery County-Bucks County-Chester County, Penn. (-2,800 jobs, -5%); Minneapolis-St. Paul-Bloomington, Minn.-Wis. (-2,400 jobs, -3%) and Columbia, S.C. (-2,200 jobs, -11%). The largest percentage decreases for the year were in Bloomington, Ill. (-16%, -500 jobs), followed by Bismarck, N.D. (-15%, -800 jobs), Auburn-Opelika, Ala. (-14%, -400 jobs); Battle Creek, Mich. (-12%, -200 jobs); and Columbia, S.C.
Association officials said that despite these widespread employment increases, many contractors report difficulty in finding qualified workers. With the national unemployment rate at a 17-year low and many metro unemployment rates at new record lows for April, finding workers is not expected to get easier in the near future. They added that education and training initiatives are the best way to increase the pool of skilled workers, creating a new generation of carpenters, electricians, and others, while giving Americans access to highly rewarding work.
"The good news is that the strong economy is driving demand for many types of construction projects," said Stephen E. Sandherr, the association's chief executive officer. "All that economic activity means that there are fewer, qualified, workers available for construction firms to hire to keep pace with demand."
Related Stories

Market Data | Jun 14, 2016
Transwestern: Market fundamentals and global stimulus driving economic growth
A new report from commercial real estate firm Transwestern indicates steady progress for the U.S. economy. Consistent job gains, wage growth, and consumer spending have offset declining corporate profits, and global stimulus plans appear to be effective.

Market Data | Jun 7, 2016
Global construction disputes took longer to resolve in 2015
The good news: the length and value of disputes in the U.S. fell last year, according to latest Arcadis report.

Market Data | Jun 3, 2016
JLL report: Retail renovation drives construction growth in 2016
Retail construction projects were up nearly 25% year-over-year, and the industrial and office construction sectors fared well, too. Economic uncertainty looms over everything, however.

Market Data | Jun 2, 2016
ABC: Nonresidential construction spending down in April
Lower building material prices, a sluggish U.S. economy, and hesitation among private developers all factor into the 2.1% drop.

Market Data | May 20, 2016
Report: Urban area population growth slows
Older Millennials are looking to buy homes and move away to more affordable suburbs and exurbs.

Market Data | May 17, 2016
Modest growth for AIA’s Architecture Billings Index in April
The American Institute of Architects reported the April ABI score was 50.6, down from the mark of 51.9 in the previous month. This score still reflects an increase in design services.

Market Data | Apr 29, 2016
ABC: Quarterly GDP growth slowest in two years
Bureau of Economic Analysis data indicates that the U.S. output is barely growing and that nonresidential investment is down.

Market Data | Apr 20, 2016
AIA: Architecture Billings Index ends first quarter on upswing
The multi-family residential sector fared the best. The Midwest was the only U.S. region that didn't see an increase in billings.
Building Technology | Apr 11, 2016
A nascent commercial wireless sensor market is poised to ascend in the next decade
Europe and Asia will propel that growth, according to a new report from Navigant.

Industry Research | Apr 7, 2016
CBRE provides latest insight into healthcare real estate investors’ strategies
Survey respondents are targeting smaller acquisitions, at a time when market cap rates are narrowing for different product types.


