

Nationally, the average cost to build out an office is $196.49/sf. But after taking into account the average landlord-provided tenant-improvement allowance of $43.61/sf, the out-of-pocket cost for tenants is $152.88/sf, according to JLL’s new U.S. Fit Out Guide.
The report combines fitout costs and tenant improvement allowances to paint a comprehensive picture of what companies can expect to pay out of pocket for an office buildout across the nation. It also details the most- and least-expensive markets for fitouts.
Coming out on top as the most expensive market to build out an office is Silicon Valley, Calif., with an out-of-pocket cost of $199.22. The most affordable market: Washington, D.C., at $103.88.
“It’s no surprise that the Northwest continues to be the most expensive region for office builds,” says Mason Mularoni, Senior Research Analyst, JLL Project and Development Services. Southern cities claimed six out of the 10 most affordable markets.
Due to the range of landlord-provided tenant improvement packages, some cities that made the top lists were pretty unexpected.
 Silicon Valley, Calif., is the most expensive market for office fitout projects, with an average out-of-pocket cost of $199.22/sf, according to JLL.
Washington, D.C.: most affordable. Often topping most-expensive lists, the District of Columbia is officially the most inexpensive market to build out an office space. As the federal government, contractors, and law firms continue to consolidate, slightly below-average buildout costs are offset by record-high concession packages from landlords who are desperate to get tenants into the exploding mass of available space.
Detroit: eighth most expensive. Once on the brink of financial collapse, the Motor City is being reinvigorated by an eager tech community. Startups, investors, and outside firms are attracted to the Motor City’s resolve to bounce back.
But Detroit isn’t in the clear just yet. Due to above-average buildout costs and minimal TI packages, the city swings in as one of the top out-of-pocket cost markets.
Los Angeles: sixth most affordable market to build out an office. New leasing activity has been nourished by the convergence of media, technology, and entertainment. The tech sector in particular has shown a preference for creative buildouts. LA’s enormous TI packages are tied with Washington, D.C., for largest in the nation, offering an affordable option in the notoriously expensive state.
Long Island, N.Y.: third most expensive, beating out traditional frontrunner New York City. When it comes to building costs alone, New York City tops the list. But substantial TI packages in the city allow Long Island to slide ahead in out-of-pocket costs, holding its own against the expensive Northern California cities.
Seattle: seventh most affordable. Although the Northwest region tops the most expensive list, Seattle is the exception to the rule. Technology continues to be the primary factor of the city, and significant growth is occurring from local companies as well as from tenants migrating from the Bay Area.
The second-largest TI package average across the nation enables Seattle to hold down seventh place in most-affordable-city honors.
Related Stories
Market Data | Jul 19, 2021
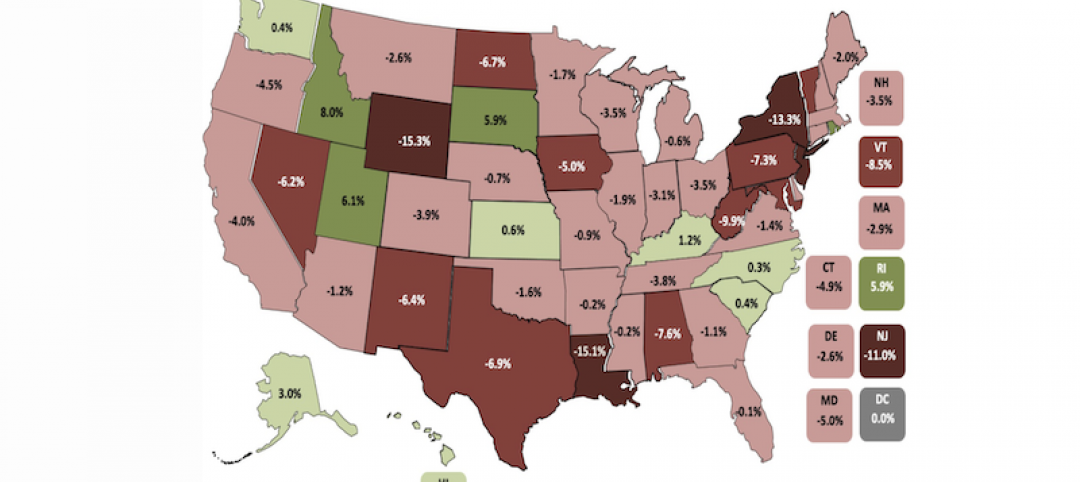
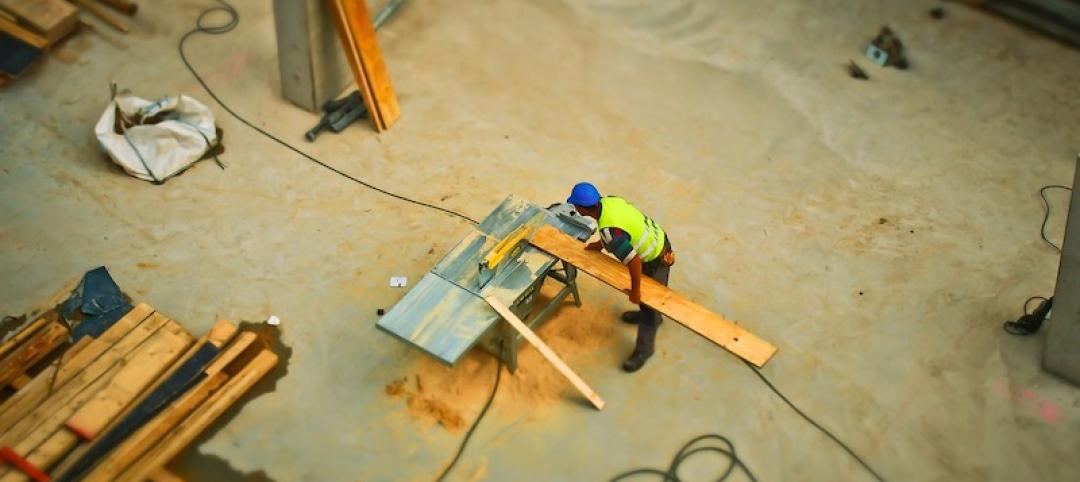
Construction employment trails pre-pandemic level in 39 states
Supply chain challenges, rising materials prices undermine demand.
Market Data | Jul 15, 2021
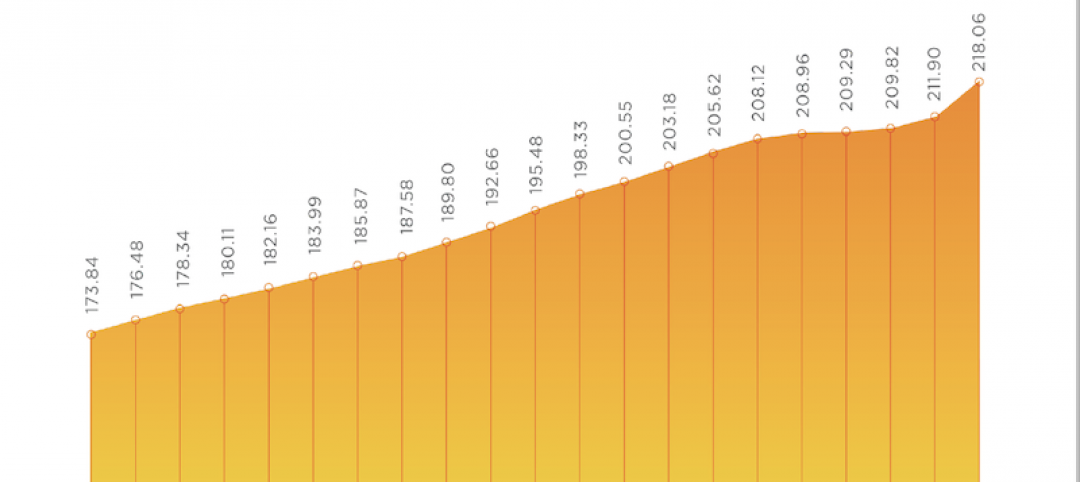
Producer prices for construction materials and services soar 26% over 12 months
Contractors cope with supply hitches, weak demand.
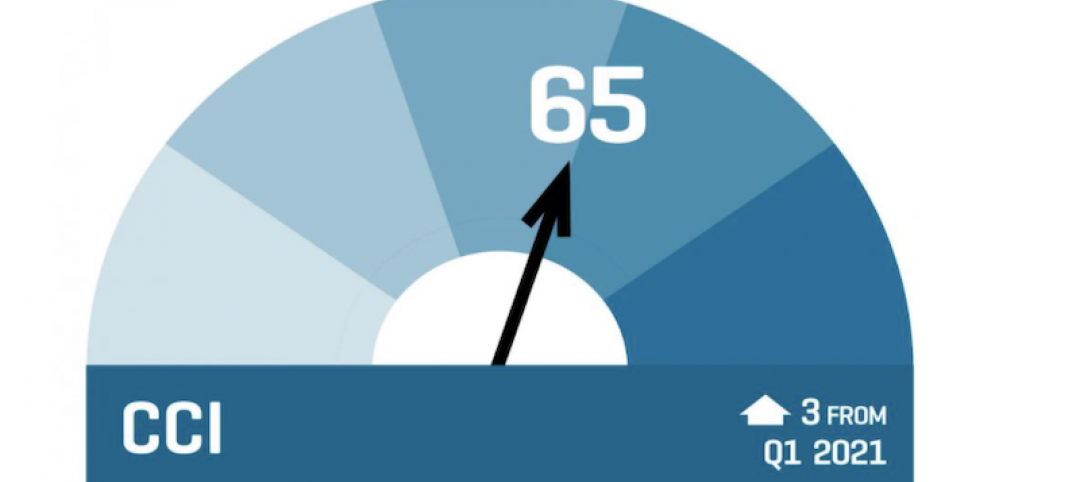
Market Data | Jul 13, 2021
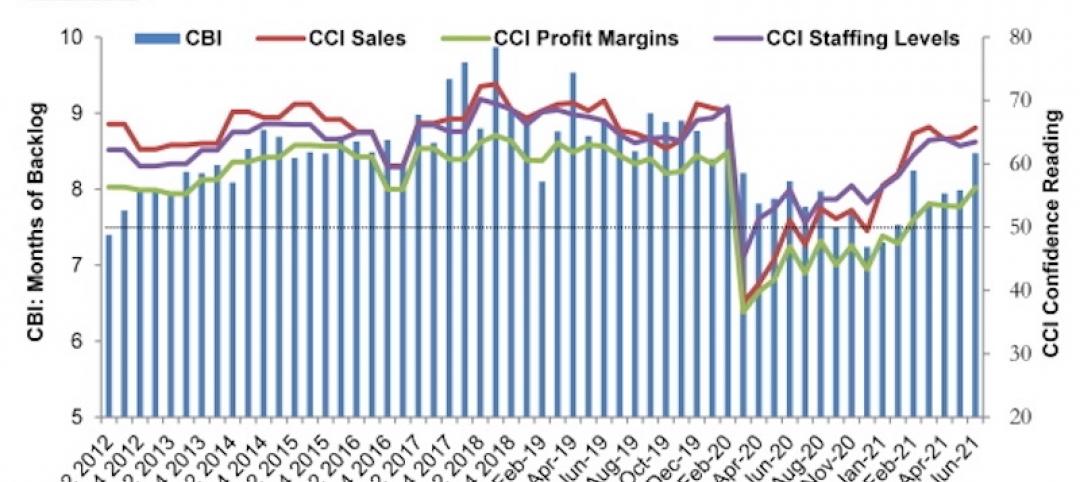
ABC’s Construction Backlog Indicator and Contractor Confidence Index rise in June
ABC’s Construction Confidence Index readings for sales, profit margins and staffing levels increased modestly in June.
Market Data | Jul 8, 2021
Encouraging construction cost trends are emerging
In its latest quarterly report, Rider Levett Bucknall states that contractors’ most critical choice will be selecting which building sectors to target.

Multifamily Housing | Jul 7, 2021
Make sure to get your multifamily amenities mix right
One of the hardest decisions multifamily developers and their design teams have to make is what mix of amenities they’re going to put into each project. A lot of squiggly factors go into that decision: the type of community, the geographic market, local recreation preferences, climate/weather conditions, physical parameters, and of course the budget. The permutations are mind-boggling.

Market Data | Jul 7, 2021
Construction employment declines by 7,000 in June
Nonresidential firms struggle to find workers and materials to complete projects.
Market Data | Jun 30, 2021
Construction employment in May trails pre-covid levels in 91 metro areas
Firms struggle to cope with materials, labor challenges.
Market Data | Jun 23, 2021
Construction employment declines in 40 states between April and May
Soaring material costs, supply-chain disruptions impede recovery.
Market Data | Jun 22, 2021
Architecture billings continue historic rebound
AIA’s Architecture Billings Index (ABI) score for May rose to 58.5 compared to 57.9 in April.
Market Data | Jun 17, 2021
Commercial construction contractors upbeat on outlook despite worsening material shortages, worker shortages
88% indicate difficulty in finding skilled workers; of those, 35% have turned down work because of it.


