

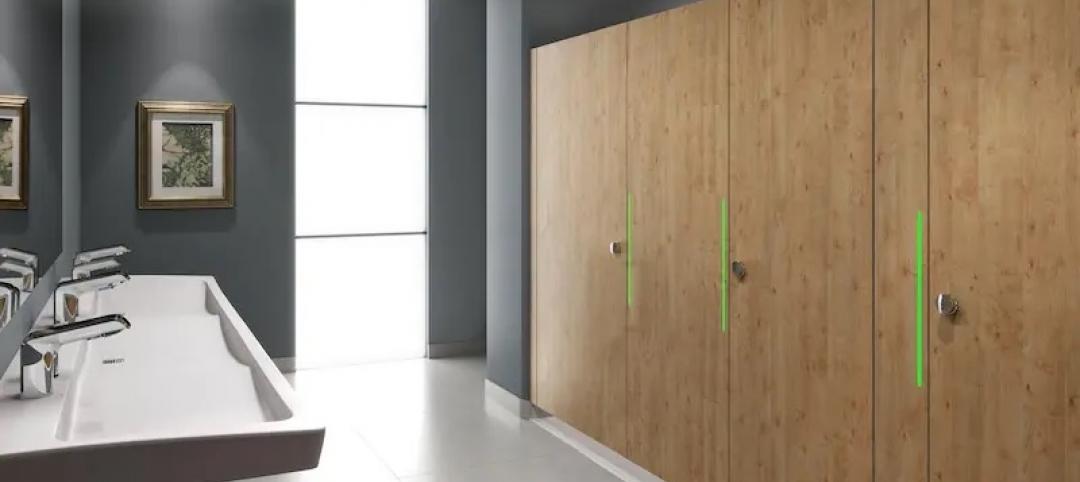
Nationally, the average cost to build out an office is $196.49/sf. But after taking into account the average landlord-provided tenant-improvement allowance of $43.61/sf, the out-of-pocket cost for tenants is $152.88/sf, according to JLL’s new U.S. Fit Out Guide.
The report combines fitout costs and tenant improvement allowances to paint a comprehensive picture of what companies can expect to pay out of pocket for an office buildout across the nation. It also details the most- and least-expensive markets for fitouts.
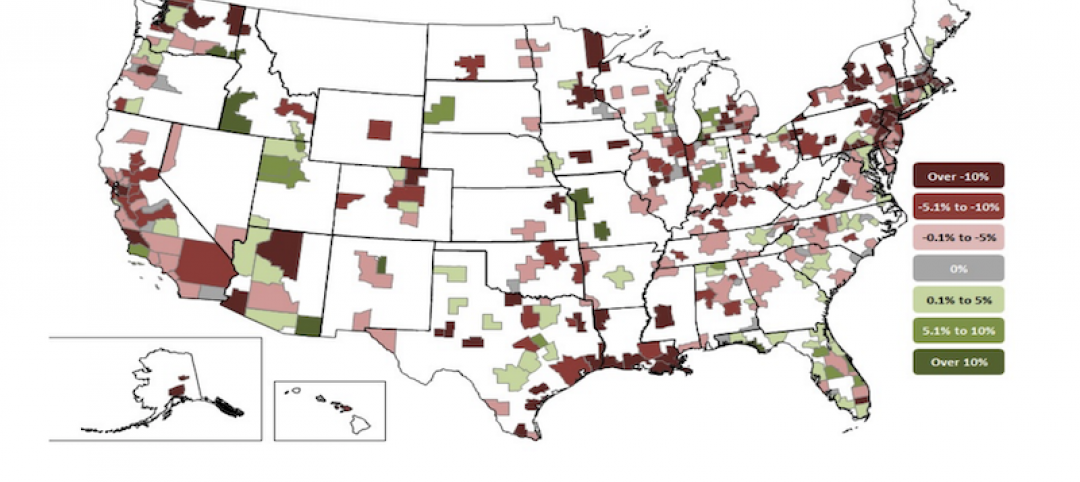
Coming out on top as the most expensive market to build out an office is Silicon Valley, Calif., with an out-of-pocket cost of $199.22. The most affordable market: Washington, D.C., at $103.88.
“It’s no surprise that the Northwest continues to be the most expensive region for office builds,” says Mason Mularoni, Senior Research Analyst, JLL Project and Development Services. Southern cities claimed six out of the 10 most affordable markets.
Due to the range of landlord-provided tenant improvement packages, some cities that made the top lists were pretty unexpected.
 Silicon Valley, Calif., is the most expensive market for office fitout projects, with an average out-of-pocket cost of $199.22/sf, according to JLL.
Washington, D.C.: most affordable. Often topping most-expensive lists, the District of Columbia is officially the most inexpensive market to build out an office space. As the federal government, contractors, and law firms continue to consolidate, slightly below-average buildout costs are offset by record-high concession packages from landlords who are desperate to get tenants into the exploding mass of available space.
Detroit: eighth most expensive. Once on the brink of financial collapse, the Motor City is being reinvigorated by an eager tech community. Startups, investors, and outside firms are attracted to the Motor City’s resolve to bounce back.
But Detroit isn’t in the clear just yet. Due to above-average buildout costs and minimal TI packages, the city swings in as one of the top out-of-pocket cost markets.
Los Angeles: sixth most affordable market to build out an office. New leasing activity has been nourished by the convergence of media, technology, and entertainment. The tech sector in particular has shown a preference for creative buildouts. LA’s enormous TI packages are tied with Washington, D.C., for largest in the nation, offering an affordable option in the notoriously expensive state.
Long Island, N.Y.: third most expensive, beating out traditional frontrunner New York City. When it comes to building costs alone, New York City tops the list. But substantial TI packages in the city allow Long Island to slide ahead in out-of-pocket costs, holding its own against the expensive Northern California cities.
Seattle: seventh most affordable. Although the Northwest region tops the most expensive list, Seattle is the exception to the rule. Technology continues to be the primary factor of the city, and significant growth is occurring from local companies as well as from tenants migrating from the Bay Area.
The second-largest TI package average across the nation enables Seattle to hold down seventh place in most-affordable-city honors.
Related Stories
Market Data | Sep 20, 2021
August construction employment lags pre-pandemic peak in 39 states
The coronavirus delta variant and supply problems hold back recovery.
Market Data | Sep 15, 2021
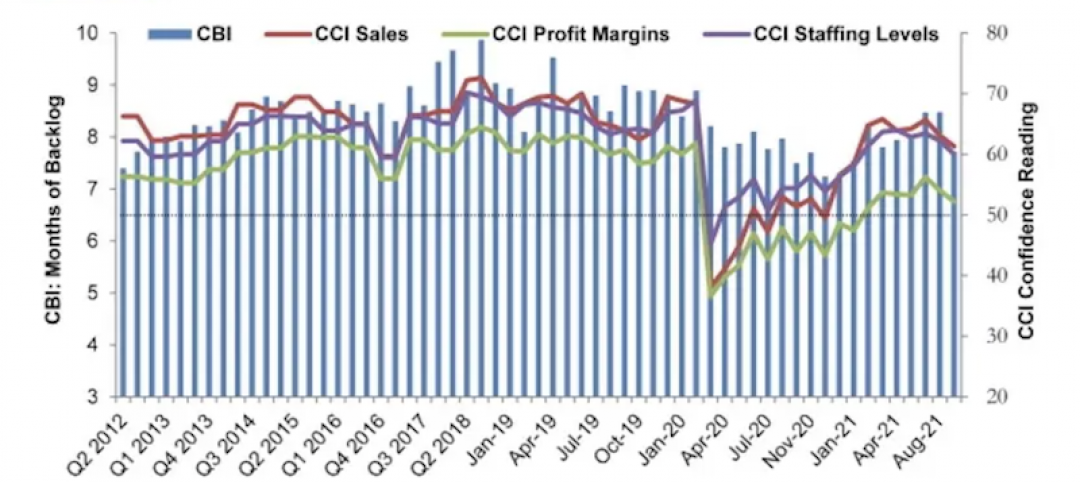
ABC’s Construction Backlog Indicator plummets in August; Contractor Confidence down
ABC’s Construction Confidence Index readings for sales, profit margins and staffing levels all fell modestly in August.
Market Data | Sep 7, 2021
Construction sheds 3,000 jobs in August
Gains are limited to homebuilding as other contractors struggle to fill both craft and salaried positions.
Market Data | Sep 3, 2021
Construction workforce shortages reach pre-pandemic levels
Coronavirus continues to impact projects and disrupt supply chains.

Multifamily Housing | Sep 1, 2021
Top 10 outdoor amenities at multifamily housing developments for 2021
Fire pits, lounge areas, and covered parking are the most common outdoor amenities at multifamily housing developments, according to new research from Multifamily Design+Construction.

Market Data | Sep 1, 2021
Construction spending posts small increase in July
Coronavirus, soaring costs, and supply disruptions threaten to erase further gains.
Market Data | Sep 1, 2021
Bradley Corp. survey finds office workers taking coronavirus precautions
Due to the rise in new strains of the virus, 70% of office workers have implemented a more rigorous handwashing regimen versus 59% of the general population.
Market Data | Aug 31, 2021
Three out of four metro areas add construction jobs from July 2020 to July 2021
COVID, rising costs, and supply chain woes may stall gains.
Market Data | Aug 24, 2021
July construction employment lags pre-pandemic peak in 36 states
Delta variant of coronavirus threatens to hold down further gains.
Market Data | Aug 17, 2021
Demand for design activity continues to expand
The ABI score for July was 54.6.


