


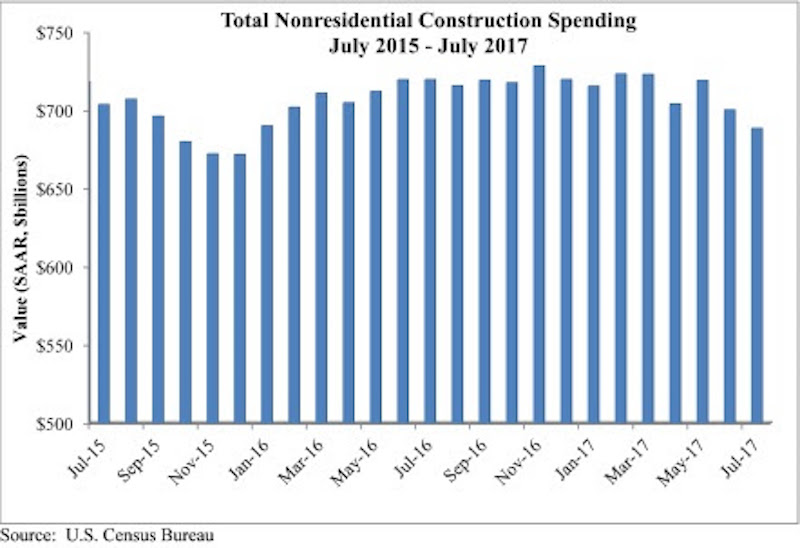
Nonresidential construction spending fell 1.7% in July, totaling $688.4 billion on a seasonally adjusted, annualized basis, according to an analysis by Associated Builders and Contractors (ABC) of data recently released by the U.S. Census Bureau. The absolute level of nonresidential construction spending was at its lowest point since December 2015.
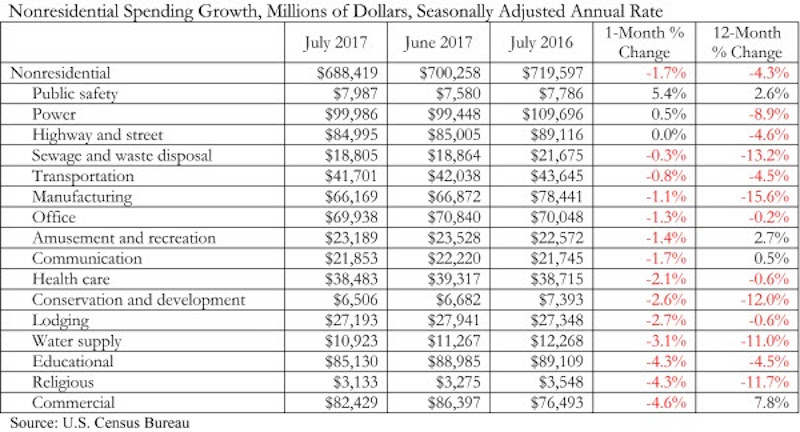
Weakness in spending was widespread. 13 of the 16 nonresidential subsectors contracted for the month. Only the public safety and power categories experienced monthly increases, while the highway and street category remained unchanged for the month. However, May and June nonresidential spending was revised upward by a collective $11 billion.
“As a society, we collect and report data in order to clarify the nature of our circumstances and how they are changing,” said ABC Chief Economist Anirban Basu. “However, recently received data have muddied, not clarified, our collective understanding of how well the nation’s nonresidential construction sector is performing.
 Courtesy ABC.
“Earlier today, we received information indicating that hiring among nonresidential construction firms was brisk in August,” said Basu. “Job growth was significant among nonresidential construction specialty trade contractors and heavy and civil engineering firms, among others. Interpreted independently, this would suggest growing activity in private and public segments.
“But today’s construction spending report points in precisely the opposite direction. Based on that data, nonresidential construction activity has been trending lower since early 2017,” said Basu. “A number of private segments that had been generating significant growth in opportunities for contractors saw activity dwindle in July, including office (-1.3%), lodging (-2.7%), and amusement and recreation (-1.4%). For economists and other stakeholders, the question now is whether today’s jobs report tells the tale or today’s spending data are a better indicator.
“Based on consideration of other factors, including leading indicators, the narrative suggesting that construction activity continues to rise seems more reasonable,” said Basu. “Anecdotally and in survey data, many nonresidential construction firms continue to report healthy backlog and are looking forward to an active 2018. Moreover, recent events in Texas and Louisiana imply that negative trends in nonresidential construction spending will be reversed as rebuilding commences.”
 Courtesy ABC.
Related Stories

Market Data | Sep 5, 2023
Nonresidential construction spending increased 0.1% in July 2023
National nonresidential construction spending grew 0.1% in July, according to an Associated Builders and Contractors analysis of data published today by the U.S. Census Bureau. On a seasonally adjusted annualized basis, nonresidential spending totaled $1.08 trillion and is up 16.5% year over year.

Giants 400 | Aug 31, 2023
Top 35 Engineering Architecture Firms for 2023
Jacobs, AECOM, Alfa Tech, Burns & McDonnell, and Ramboll top the rankings of the nation's largest engineering architecture (EA) firms for nonresidential buildings and multifamily buildings work, as reported in Building Design+Construction's 2023 Giants 400 Report.

Giants 400 | Aug 22, 2023
Top 115 Architecture Engineering Firms for 2023
Stantec, HDR, Page, HOK, and Arcadis North America top the rankings of the nation's largest architecture engineering (AE) firms for nonresidential building and multifamily housing work, as reported in Building Design+Construction's 2023 Giants 400 Report.

Giants 400 | Aug 22, 2023
2023 Giants 400 Report: Ranking the nation's largest architecture, engineering, and construction firms
A record 552 AEC firms submitted data for BD+C's 2023 Giants 400 Report. The final report includes 137 rankings across 25 building sectors and specialty categories.

Giants 400 | Aug 22, 2023
Top 175 Architecture Firms for 2023
Gensler, HKS, Perkins&Will, Corgan, and Perkins Eastman top the rankings of the nation's largest architecture firms for nonresidential building and multifamily housing work, as reported in Building Design+Construction's 2023 Giants 400 Report.

Apartments | Aug 22, 2023
Key takeaways from RCLCO's 2023 apartment renter preferences study
Gregg Logan, Managing Director of real estate consulting firm RCLCO, reveals the highlights of RCLCO's new research study, “2023 Rental Consumer Preferences Report.” Logan speaks with BD+C's Robert Cassidy.

Market Data | Aug 18, 2023
Construction soldiers on, despite rising materials and labor costs
Quarterly analyses from Skanska, Mortenson, and Gordian show nonresidential building still subject to materials and labor volatility, and regional disparities.

Apartments | Aug 14, 2023
Yardi Matrix updates near-term multifamily supply forecast
The multifamily housing supply could increase by up to nearly 7% by the end of 2023, states the latest Multifamily Supply Forecast from Yardi Matrix.

Hotel Facilities | Aug 2, 2023
Top 5 markets for hotel construction
According to the United States Construction Pipeline Trend Report by Lodging Econometrics (LE) for Q2 2023, the five markets with the largest hotel construction pipelines are Dallas with a record-high 184 projects/21,501 rooms, Atlanta with 141 projects/17,993 rooms, Phoenix with 119 projects/16,107 rooms, Nashville with 116 projects/15,346 rooms, and Los Angeles with 112 projects/17,797 rooms.

Market Data | Aug 1, 2023
Nonresidential construction spending increases slightly in June
National nonresidential construction spending increased 0.1% in June, according to an Associated Builders and Contractors analysis of data published today by the U.S. Census Bureau. Spending is up 18% over the past 12 months. On a seasonally adjusted annualized basis, nonresidential spending totaled $1.07 trillion in June.


