


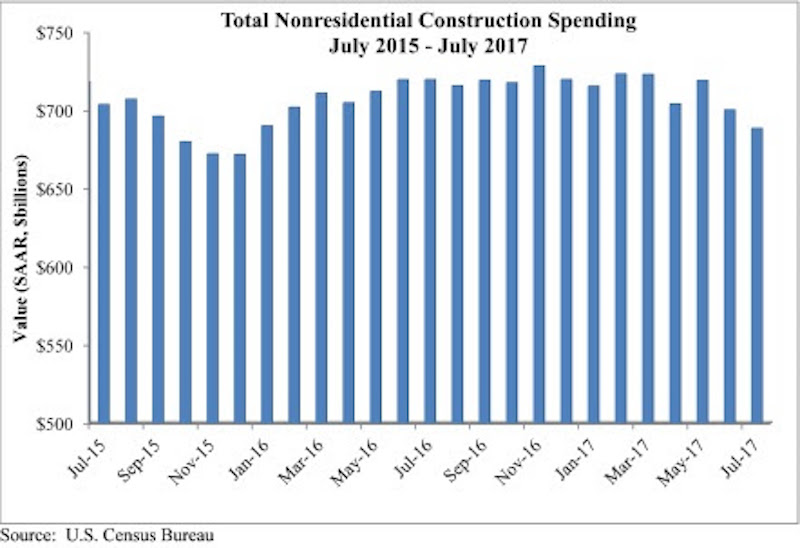
Nonresidential construction spending fell 1.7% in July, totaling $688.4 billion on a seasonally adjusted, annualized basis, according to an analysis by Associated Builders and Contractors (ABC) of data recently released by the U.S. Census Bureau. The absolute level of nonresidential construction spending was at its lowest point since December 2015.
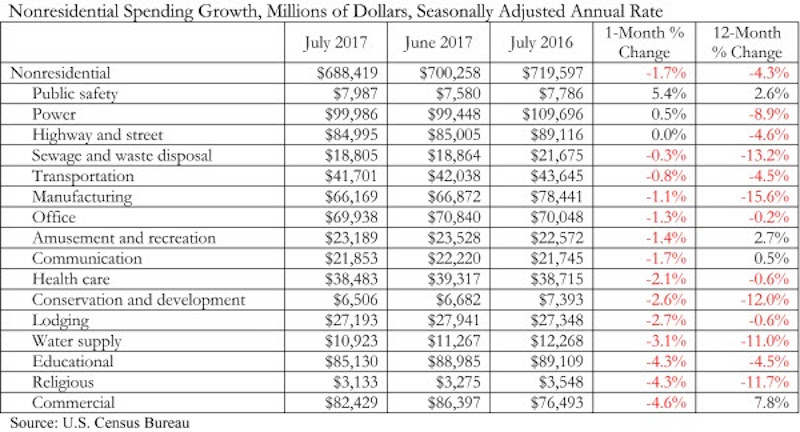
Weakness in spending was widespread. 13 of the 16 nonresidential subsectors contracted for the month. Only the public safety and power categories experienced monthly increases, while the highway and street category remained unchanged for the month. However, May and June nonresidential spending was revised upward by a collective $11 billion.
“As a society, we collect and report data in order to clarify the nature of our circumstances and how they are changing,” said ABC Chief Economist Anirban Basu. “However, recently received data have muddied, not clarified, our collective understanding of how well the nation’s nonresidential construction sector is performing.
 Courtesy ABC.
“Earlier today, we received information indicating that hiring among nonresidential construction firms was brisk in August,” said Basu. “Job growth was significant among nonresidential construction specialty trade contractors and heavy and civil engineering firms, among others. Interpreted independently, this would suggest growing activity in private and public segments.
“But today’s construction spending report points in precisely the opposite direction. Based on that data, nonresidential construction activity has been trending lower since early 2017,” said Basu. “A number of private segments that had been generating significant growth in opportunities for contractors saw activity dwindle in July, including office (-1.3%), lodging (-2.7%), and amusement and recreation (-1.4%). For economists and other stakeholders, the question now is whether today’s jobs report tells the tale or today’s spending data are a better indicator.
“Based on consideration of other factors, including leading indicators, the narrative suggesting that construction activity continues to rise seems more reasonable,” said Basu. “Anecdotally and in survey data, many nonresidential construction firms continue to report healthy backlog and are looking forward to an active 2018. Moreover, recent events in Texas and Louisiana imply that negative trends in nonresidential construction spending will be reversed as rebuilding commences.”
 Courtesy ABC.
Related Stories

Market Data | Mar 14, 2024
Download BD+C's March 2024 Market Intelligence Report
U.S. construction spending on buildings-related work rose 1.4% in January, but project teams continue to face headwinds related to inflation, interest rates, and supply chain issues, according to Building Design+Construction's March 2024 Market Intelligence Report (free PDF download).

Contractors | Mar 12, 2024
The average U.S. contractor has 8.1 months worth of construction work in the pipeline, as of February 2024
Associated Builders and Contractors reported that its Construction Backlog Indicator declined to 8.1 months in February, according to an ABC member survey conducted Feb. 20 to March 5. The reading is down 1.1 months from February 2023.

Market Data | Mar 6, 2024
Nonresidential construction spending slips 0.4% in January
National nonresidential construction spending decreased 0.4% in January, according to an Associated Builders and Contractors analysis of data published today by the U.S. Census Bureau. On a seasonally adjusted annualized basis, nonresidential spending totaled $1.190 trillion.

Multifamily Housing | Mar 4, 2024
Single-family rentals continue to grow in BTR communities
Single-family rentals are continuing to grow in built-to-rent communities. Both rent and occupancy growth have been strong in recent months while remaining a financially viable option for renters.

MFPRO+ News | Mar 2, 2024
Job gains boost Yardi Matrix National Rent Forecast for 2024
Multifamily asking rents broke the five-month streak of sequential average declines in January, rising 0.07 percent, shows a new special report from Yardi Matrix.

K-12 Schools | Feb 29, 2024
Average age of U.S. school buildings is just under 50 years
The average age of a main instructional school building in the United States is 49 years, according to a survey by the National Center for Education Statistics (NCES). About 38% of schools were built before 1970. Roughly half of the schools surveyed have undergone a major building renovation or addition.

MFPRO+ Research | Feb 27, 2024
Most competitive rental markets of early 2024
The U.S. rental market in early 2024 is moderately competitive, with apartments taking an average of 41 days to find tenants, according to the latest RentCafe Market Competitivity Report.

Construction Costs | Feb 22, 2024
K-12 school construction costs for 2024
Data from Gordian breaks down the average cost per square foot for four different types of K-12 school buildings (elementary schools, junior high schools, high schools, and vocational schools) across 10 U.S. cities.

Student Housing | Feb 21, 2024
Student housing preleasing continues to grow at record pace
Student housing preleasing continues to be robust even as rent growth has decelerated, according to the latest Yardi Matrix National Student Housing Report.

Architects | Feb 21, 2024
Architecture Billings Index remains in 'declining billings' state in January 2024
Architecture firm billings remained soft entering into 2024, with an AIA/Deltek Architecture Billings Index (ABI) score of 46.2 in January. Any score below 50.0 indicates decreasing business conditions.


