


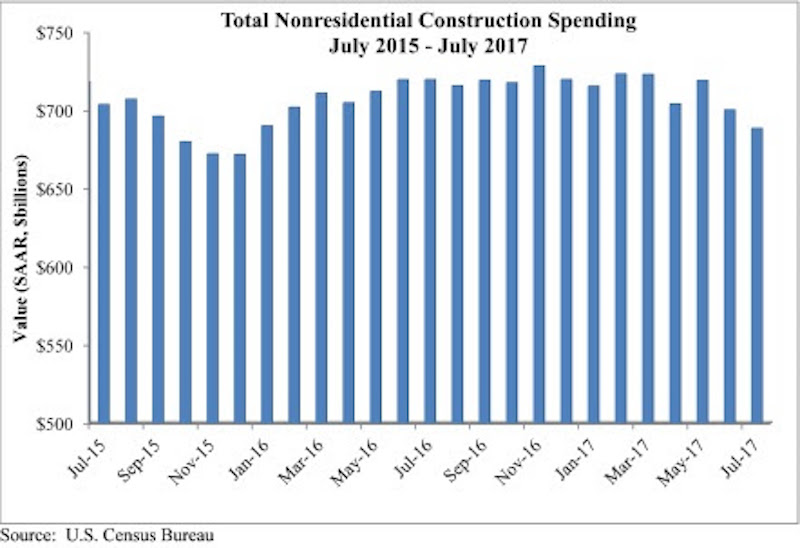
Nonresidential construction spending fell 1.7% in July, totaling $688.4 billion on a seasonally adjusted, annualized basis, according to an analysis by Associated Builders and Contractors (ABC) of data recently released by the U.S. Census Bureau. The absolute level of nonresidential construction spending was at its lowest point since December 2015.
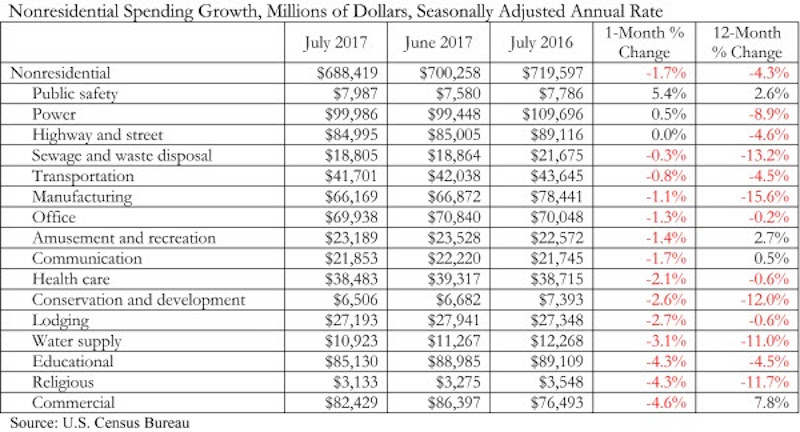
Weakness in spending was widespread. 13 of the 16 nonresidential subsectors contracted for the month. Only the public safety and power categories experienced monthly increases, while the highway and street category remained unchanged for the month. However, May and June nonresidential spending was revised upward by a collective $11 billion.
“As a society, we collect and report data in order to clarify the nature of our circumstances and how they are changing,” said ABC Chief Economist Anirban Basu. “However, recently received data have muddied, not clarified, our collective understanding of how well the nation’s nonresidential construction sector is performing.
 Courtesy ABC.
“Earlier today, we received information indicating that hiring among nonresidential construction firms was brisk in August,” said Basu. “Job growth was significant among nonresidential construction specialty trade contractors and heavy and civil engineering firms, among others. Interpreted independently, this would suggest growing activity in private and public segments.
“But today’s construction spending report points in precisely the opposite direction. Based on that data, nonresidential construction activity has been trending lower since early 2017,” said Basu. “A number of private segments that had been generating significant growth in opportunities for contractors saw activity dwindle in July, including office (-1.3%), lodging (-2.7%), and amusement and recreation (-1.4%). For economists and other stakeholders, the question now is whether today’s jobs report tells the tale or today’s spending data are a better indicator.
“Based on consideration of other factors, including leading indicators, the narrative suggesting that construction activity continues to rise seems more reasonable,” said Basu. “Anecdotally and in survey data, many nonresidential construction firms continue to report healthy backlog and are looking forward to an active 2018. Moreover, recent events in Texas and Louisiana imply that negative trends in nonresidential construction spending will be reversed as rebuilding commences.”
 Courtesy ABC.
Related Stories

Contractors | Apr 19, 2023
Rising labor, material prices cost subcontractors $97 billion in unplanned expenses
Subcontractors continue to bear the brunt of rising input costs for materials and labor, according to a survey of nearly 900 commercial construction professionals.

Data Centers | Apr 14, 2023
JLL's data center outlook: Cloud computing, AI driving exponential growth for data center industry
According to JLL’s new Global Data Center Outlook, the mass adoption of cloud computing and artificial intelligence (AI) is driving exponential growth for the data center industry, with hyperscale and edge computing leading investor demand.

Healthcare Facilities | Apr 13, 2023
Healthcare construction costs for 2023
Data from Gordian breaks down the average cost per square foot for a three-story hospital across 10 U.S. cities.

Higher Education | Apr 13, 2023
Higher education construction costs for 2023
Fresh data from Gordian breaks down the average cost per square foot for a two-story college classroom building across 10 U.S. cities.

Market Data | Apr 13, 2023
Construction input prices down year-over-year for first time since August 2020
Construction input prices increased 0.2% in March, according to an Associated Builders and Contractors analysis of U.S. Bureau of Labor Statistics Producer Price Index data released today. Nonresidential construction input prices rose 0.4% for the month.

Market Data | Apr 11, 2023
Construction crane count reaches all-time high in Q1 2023
Toronto, Seattle, Los Angeles, and Denver top the list of U.S/Canadian cities with the greatest number of fixed cranes on construction sites, according to Rider Levett Bucknall's RLB Crane Index for North America for Q1 2023.

Contractors | Apr 11, 2023
The average U.S. contractor has 8.7 months worth of construction work in the pipeline, as of March 2023
Associated Builders and Contractors reported that its Construction Backlog Indicator declined to 8.7 months in March, according to an ABC member survey conducted March 20 to April 3. The reading is 0.4 months higher than in March 2022.

Market Data | Apr 6, 2023
JLL’s 2023 Construction Outlook foresees growth tempered by cost increases
The easing of supply chain snags for some product categories, and the dispensing with global COVID measures, have returned the North American construction sector to a sense of normal. However, that return is proving to be complicated, with the construction industry remaining exceptionally busy at a time when labor and materials cost inflation continues to put pricing pressure on projects, leading to caution in anticipation of a possible downturn. That’s the prognosis of JLL’s just-released 2023 U.S. and Canada Construction Outlook.

Market Data | Apr 4, 2023
Nonresidential construction spending up 0.4% in February 2023
National nonresidential construction spending increased 0.4% in February, according to an Associated Builders and Contractors analysis of data published by the U.S. Census Bureau. On a seasonally adjusted annualized basis, nonresidential spending totaled $982.2 billion for the month, up 16.8% from the previous year.

Multifamily Housing | Mar 24, 2023
Average size of new apartments dropped sharply in 2022
The average size of new apartments in 2022 dropped sharply in 2022, as tracked by RentCafe. Across the U.S., the average new apartment size was 887 sf, down 30 sf from 2021, which was the largest year-over-year decrease.


