

While materials and labor price hikes continue to create havoc, they don’t seem to be shackling demand or activity for nonresidential construction, according to Skanska’s Summer 2023 Construction Market Trends Report, which looks at pricing and supply-chain trends for 14 product groups, and forecasts local construction costs for 21 markets across the U.S.
“Despite being the most expensive construction environment we have ever experienced … the health of the construction industry remains quite strong,” wrote Steve Stouthamer, Executive Vice President, Project Planning, Skanska USA Building, and one of the Skanska executives who produced this 43-page report. Stouthamer added that commercial office development and residential markets remain the most challenged by interest rate pressures, and offices are still contending with high vacancy rates.
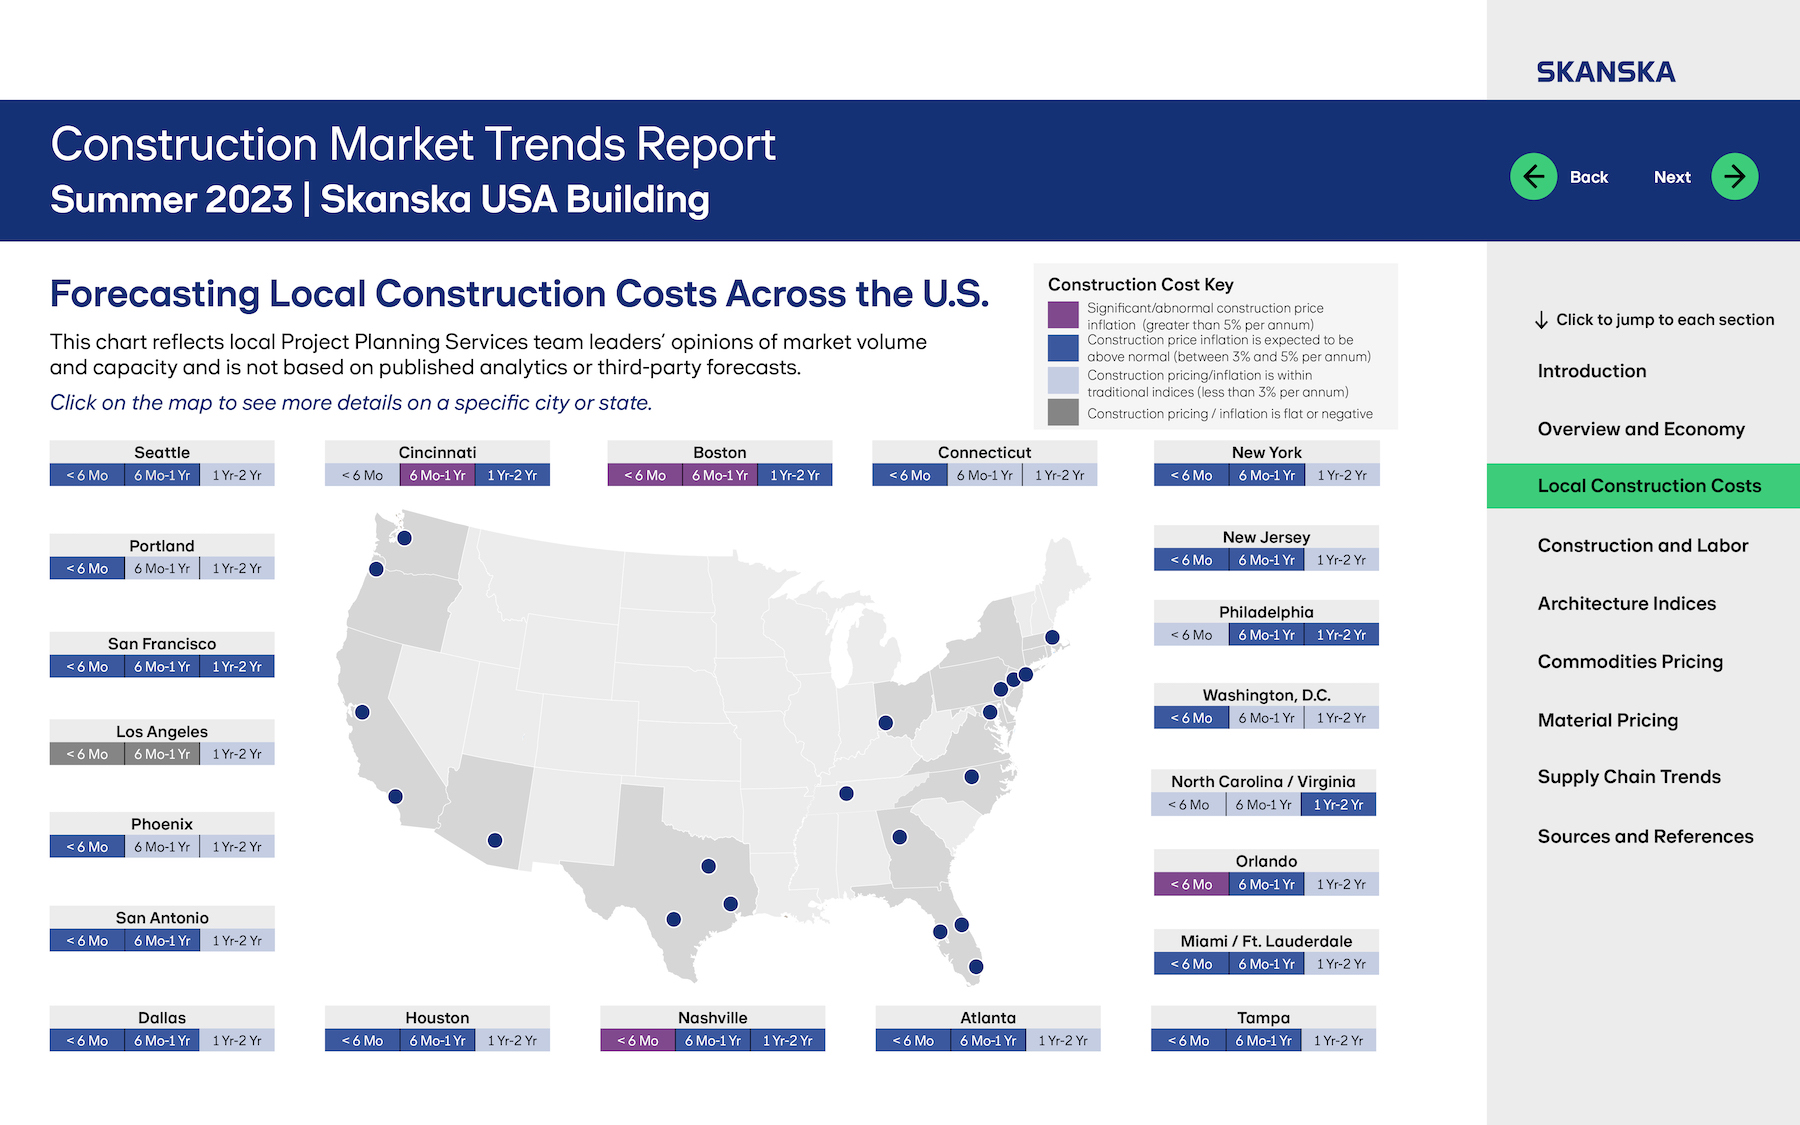
Skanska anticipates significant or abnormal construction price inflation (greater than 5 percent per year) over the next six to 12 months in Nashville, Boston, Cincinnati, and Orlando. Indeed, with the exception of Los Angeles and the North Carolina/Virginia region, the other markets that Skanksa’s report tracks are expected to experience at least above-normal (3-5% per annum) construction price inflation over the next six to 24 months.
Different sectors driving local economies
Skanska evaluated business conditions and prospects for each of the markets it tracked.
Take Seattle, for example: New labor agreements, coupled with manpower shortages and the availability of materials and equipment, are pushing construction prices up. But much-needed tourism is returning there, re-energizing the retail, hospitality, and aviation sectors. And outside of the downtown core, Skanska saw “plenty of opportunities for new projects,” notably in K-12, mass transit, and aviation.
In Philadelphia, the same inflation dynamic exists. But that hasn’t stopped Philly’s healthcare sector from gaining momentum, and life sciences continues to be vibrant, “with new capital projects and office as clients realize the importance of new amenity space to bring staff back to work.” Skanska also foresees a laggard Higher Ed sector in recovery, with several new projects under consideration for this year and next.
Skanska’s report cited the Architecture Billings Index in June as another barometer of construction demand, and the news was mixed. While business conditions have improved for architecture firms in all regions except the West, the pace of growth inquiries since March has slowed, and the value of new design contracts has declined.
An uncertain stability for construction costs
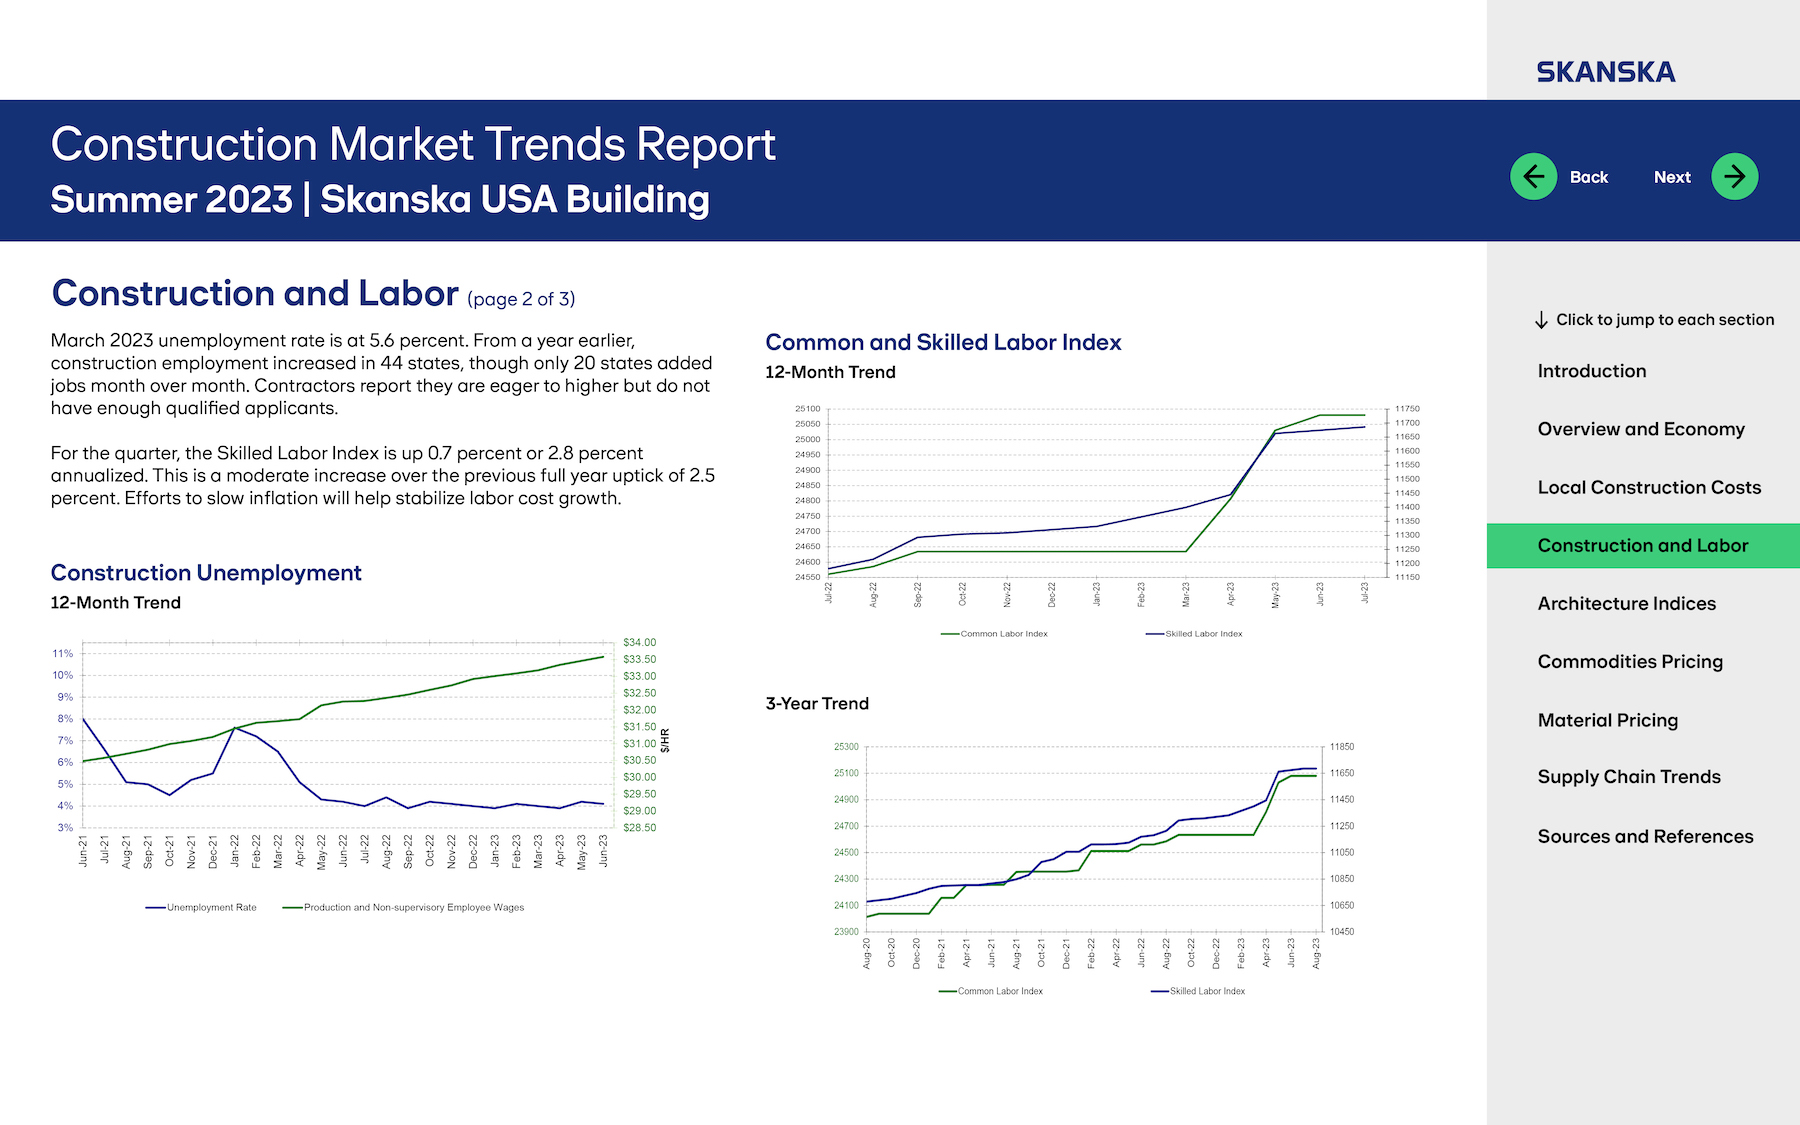
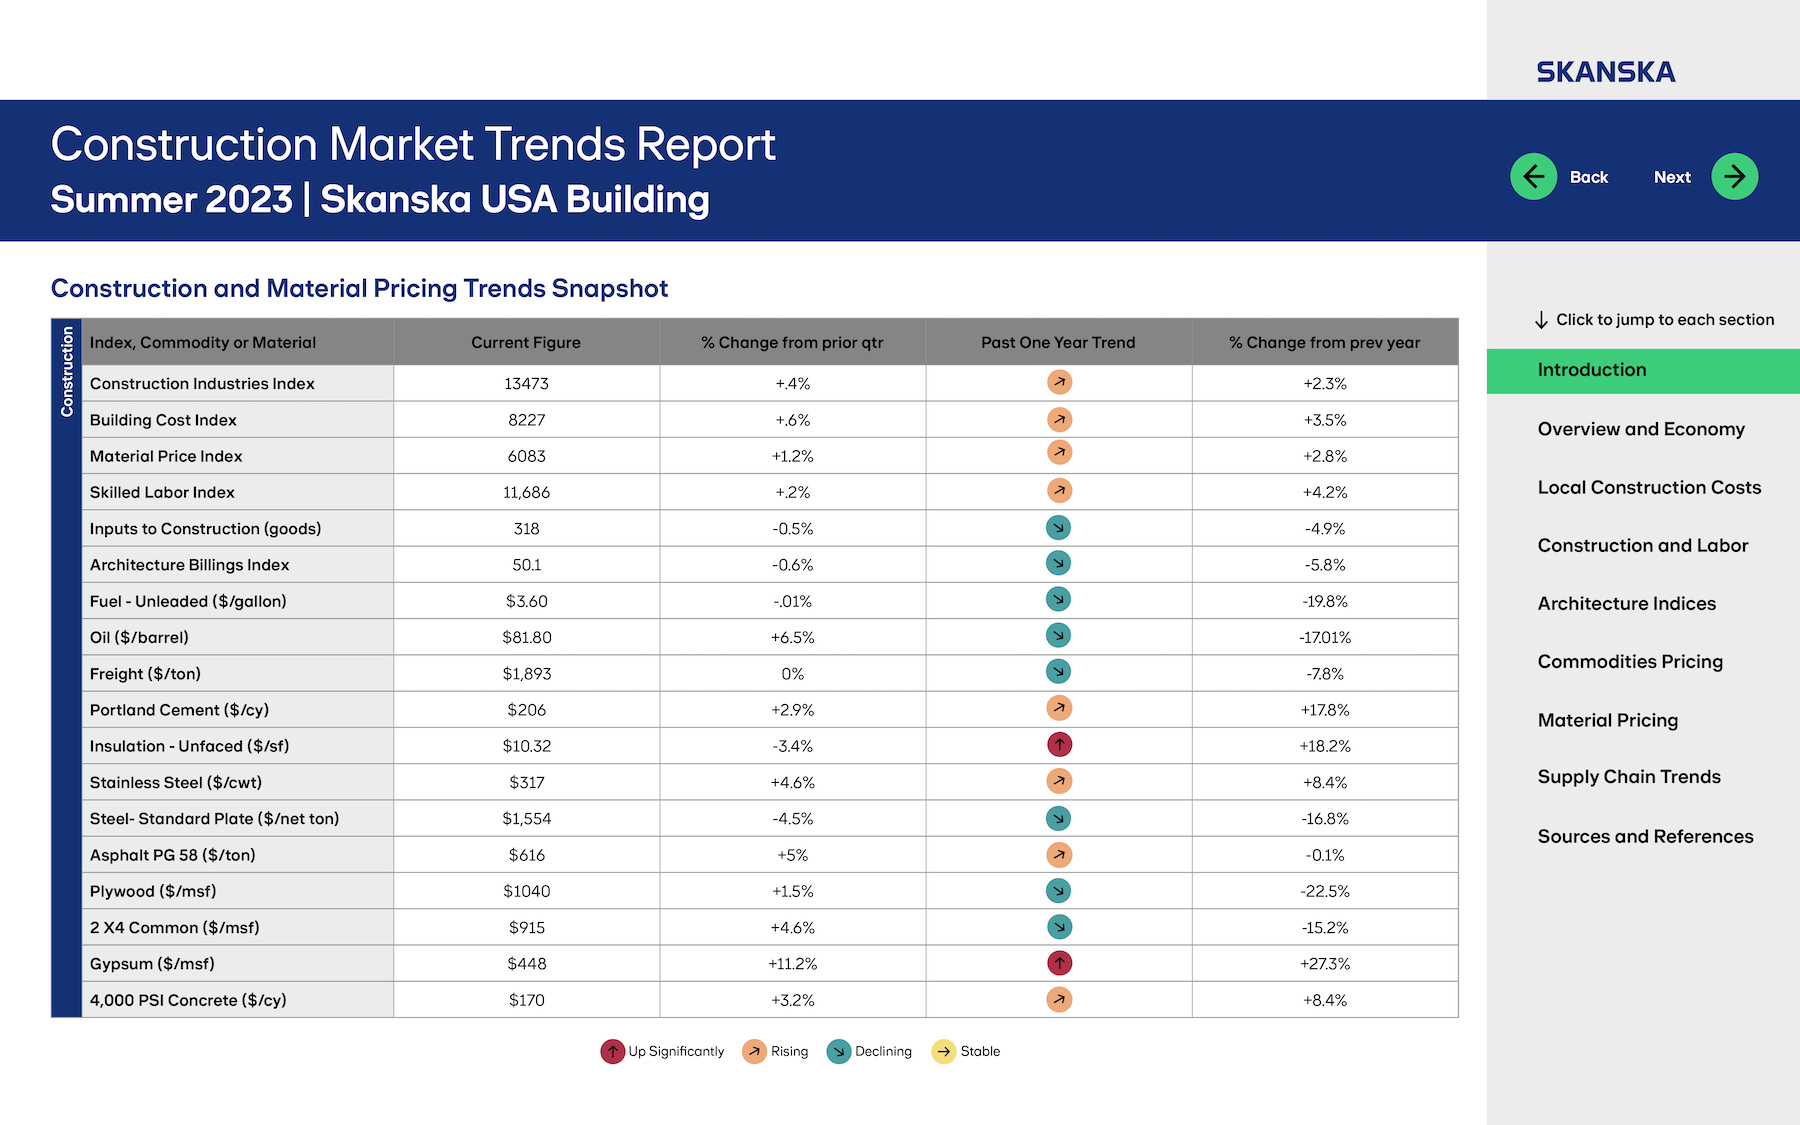
Every metro market tracked in Skanska’s report has had to cope with rising costs for materials and labor, which Skanska estimates rose nationally by 4.2% and 2.8% respectively, compared to the same period a year ago. But only two product categories—unfaced insulation and 4,000-psi gypsum—were up significantly: by 18.2% and 27.3%, respectively. Conversely, the costs of three product groups tracked–-standard plate steel, plywood, and 2x4s—were trending downward. Skanska also reported declines in the cost of fuel, oil, and freight, though the firm expected fuel costs to remain “elevated” through the rest of this year.
Softness in asphalt pricing is tied to lower seasonal demand, and Skanska expects prices for this material to increase again based on infrastructure work. Cement and concrete prices continued to improve early this year, but could increase dramatically as the weather got warmer. The pricing for structural steel has also stabilized, but Skanska expects a slight uptick in the future. Pricing for aluminum and copper, despite moderate declines, remain high compared to historical levels, as demand is strong.
As for product availability, Skanska said that over the previous quarter, the construction supply chain has continued to improve, “most notably around raw material prices for PVC resins, steel, copper, and lumber.” The supply chain for roofing products “has fully recovered.” Inventory for plumbing and fixtures appears to be healthy.
The challenges lie with HVAC and electrical gear availability. though several HVAC equipment manufacturers have reported improvements in their backlogs of orders due to increased factory capacity. (The one glaring exception is chillers that still have lead times of between 45 and 65 weeks.)
Skanska predicted that the construction industry’s lean toward electrification, as well as investment in data centers, will likely last for several more years. Investment in production capacity for electrical equipment products should allow manufacturers to be able to keep up with “persistent demand.”
Regional takes on construction costs
Looking at market conditions from a slightly narrower perspective, Mortenson’s just-released nonresidential Construction Cost Index, which tracks quarterly spending and inflation trends in seven markets—Seattle, Portland, Denver, Phoenix, Milwaukee, Chicago, and Minneapolis—stood at 182 nationally in the second quarter of 2023, or 8.72% higher than for all of 2021. Within that time frame, Phoenix saw the biggest increase in its index (12.22% to 187.3), and Portland the smallest (6.06% to 187.4).
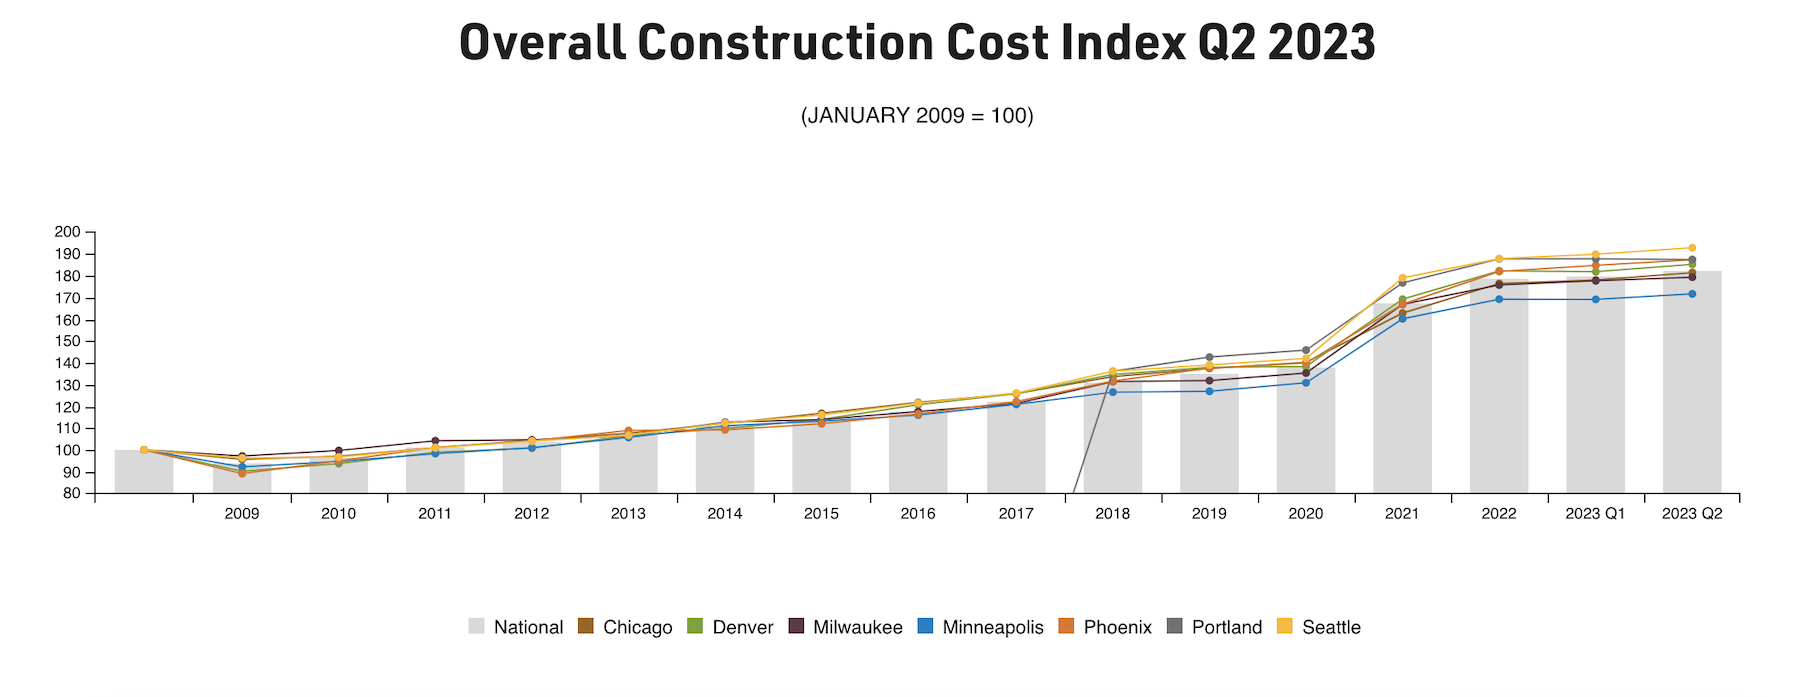
“Our construction cost index shows a continued flattening of material costs, suggesting pandemic, supply-chain, and inflation-related increases experienced over the last two years have largely abated,” states Mortenson. Nationally, nonresidential construction costs during Q223 increased year over year by 2.94%. Mortenson’s overall outlook for nonresidential construction remains optimistic but also cautious, primarily because increasing labor costs “are beginning to offset the stabilization.”
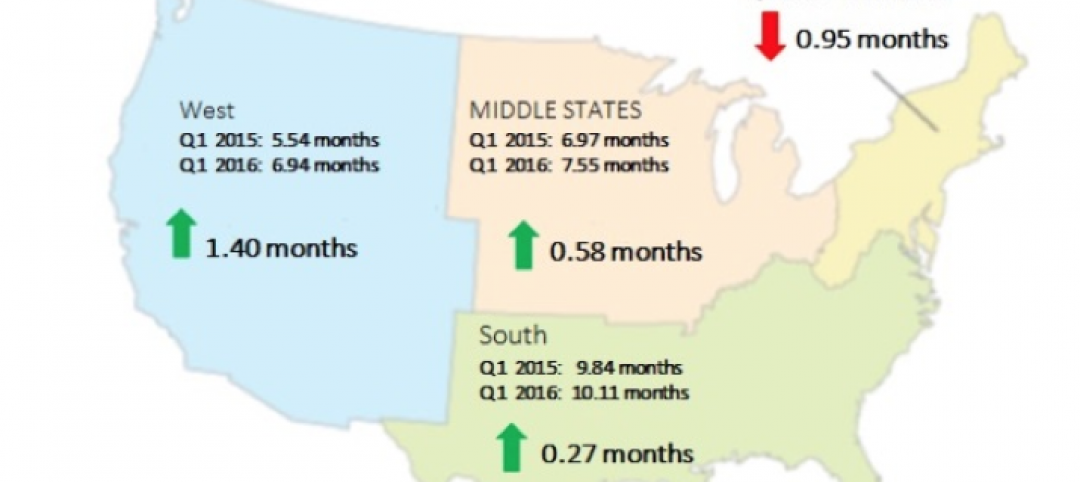
Data from Gordian’s RSMeans City Cost Index illustrates how dramatically costs differ by region, and how doing business in coastal markets is more expensive.
The City Cost Index takes into account the costs of labor, materials, and equipment, and compares that aggregate number to a national average of 30 major U.S. cities. The cost model encompasses 66 materials, 21 trades, and six pieces of equipment (plus fuel and maintenance costs).
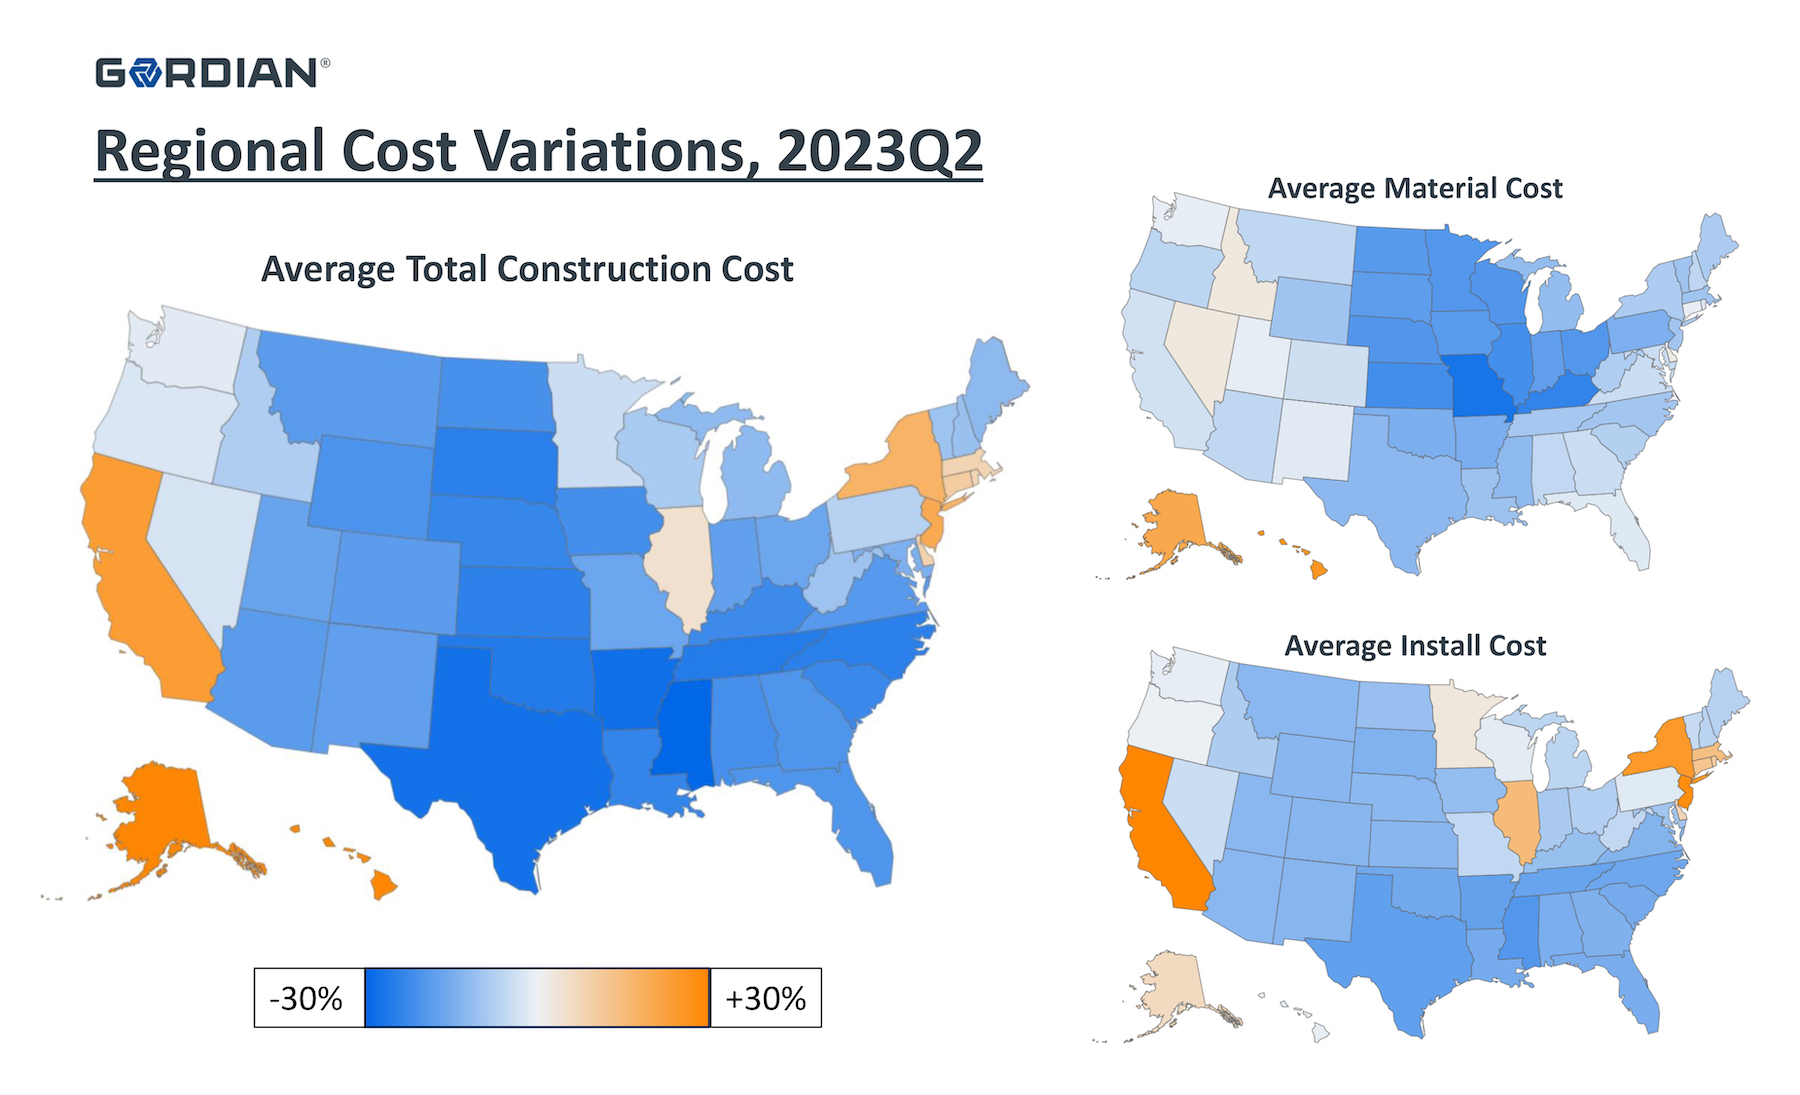
The map above illustrates regional cost differences during the second quarter of 2023. Here are some takeaways:
•The average costs of construction are highest across California, Hawaii, and Alaska; and lowest across Mississippi;
•Materials costs are highest as you move farther east and west from the Mississippi River;
•Costs for installation (labor and equipment) are highest in the West and Northeast.
Related Stories
Multifamily Housing | Aug 12, 2016
Apartment completions in largest metros on pace to increase by 50% in 2016
Texas is leading this multifamily construction boom, according to latest RENTCafé estimates.
Market Data | Jul 29, 2016
ABC: Output expands, but nonresidential fixed investment falters
Nonresidential fixed investment fell for a third consecutive quarter, as indicated by Bureau of Economic Analysis data.
Industry Research | Jul 26, 2016
AIA consensus forecast sees construction spending on rise through next year
But several factors could make the industry downshift.

Architects | Jul 20, 2016
AIA: Architecture Billings Index remains on solid footing
The June ABI score was down from May, but the figure was positive for the fifth consecutive month.

Market Data | Jul 7, 2016
Airbnb alleged to worsen housing crunch in New York City
Allegedly removing thousands of housing units from market, driving up rents.

Market Data | Jul 6, 2016
Construction spending falls 0.8% from April to May
The private and public sectors have a combined estimated seasonally adjusted annual rate of $1.14 trillion.

Market Data | Jul 6, 2016
A thriving economy and influx of businesses spur construction in downtown Seattle
Development investment is twice what it was five years ago.

Multifamily Housing | Jul 5, 2016
Apartments continue to shrink, rents continue to rise
Latest survey by RENTCafé tracks size changes in 95 metros.
Multifamily Housing | Jun 22, 2016
Can multifamily construction keep up with projected demand?
The Joint Center for Housing Studies’ latest disection of America’s housing market finds moderate- and low-priced rentals in short supply.
Contractors | Jun 21, 2016
Bigness counts when it comes to construction backlogs
Large companies that can attract talent are better able to commit to more work, according to a national trade group for builders and contractors.


