

The nation is at the beginning stages of a 20-plus year surge in its older population. By 2035, one in five people in the U.S. will be aged 65 and over, up from one in seven today. By that same year, one in three households will be headed by someone aged 65 or older.
Those projections come from a new report published by the Harvard Joint Center of Housing Studies, which examines the challenges that lie ahead for a country where owners and renters are getting older, more diverse, but also more likely to be struggling with physical and mental infirmities that require regular care.
Will the housing sector be up to meeting the demands of an older population, many of whom prefer to age in their current residences? “A wider array of housing types can offer safer, more affordable, and lower-maintenance homes within existing communities,” the report states.
First, some statistics: The Census Bureau estimates the 65-and-over population will increase by more than 30 million people by 2035 and reach 79 million, with more than half that growth occurring in the next decade. The 80-and-over population alone will double between 2015 and 2035 to 24 million, with 70 percent of that growth occurring from 2025-2035.
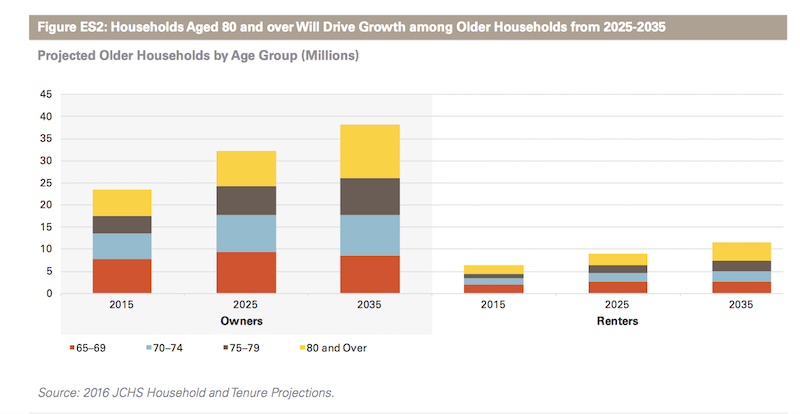
The Joint Center projects that this population growth will translate into an increase of nearly 20 million older households, from 29.9 million in 2015 to 49.6 million by 2035. The number of owner households headed by a person aged 65 or over will soar from 24 million in 2015 to 32 million by 2025, and then to 38 million by 2035, an overall increase of 62%. Homeowner households headed by someone aged 80 or over will experience particularly steep growth, more than doubling from nearly 6 million to over 12 million within the next 20 years.
Over these two decades, the sheer growth in the older population will mean the number of renter households will expand from 6 million to more than 11 million households. Overall, the share of renters will increase slightly, from 21% of older households in 2015 to 23% in 2035.
Single-person households will grow slightly more quickly among older adults to total roughly 22 million households in 2035, barely outnumbering the 21 million projected married-couple households age 65 and over.
As the population ages, the home is an increasingly important setting for the delivery of long-term care, a trend likely to grow over the next two decades as millions more seek to remain in their current dwellings while coping with disabilities and health challenges.
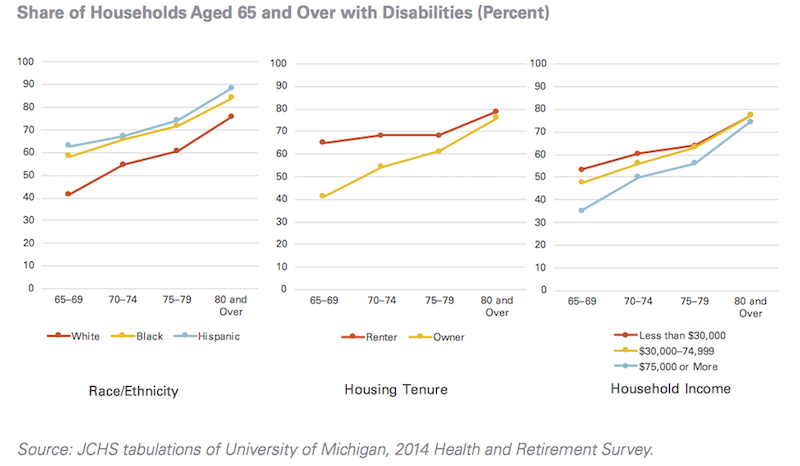 The home will increasingly become a setting for delivery of long-term care in the U.S., where older householders with a disability will grow by 76% to 31.2 milion by 2035. Image: Joint Center for Housing Studies
By 2035, older households with a disability will increase by 76 percent to reach 31.2 million. By that time, 17 million older households will include someone with a mobility disability, 12 million with a self-care disability, and 27 million with a household activity disability. Roughly half the anticipated increase of 13.4 million older households with disabilities will occur by 2025, with the remainder in the 2025-2035 decade.
By 2035, 17 million older adult households will have at least one person with a mobility disability, for whom stairs, narrow corridors and doorways, and traditional bathroom layouts will pose challenges to safety and independence. Over five million of these will be renter households. Renters are more likely than owners to have mobility disabilities, but also have less control over modifying their units.
The conundrum is that only 1 percent of the current housing stock offers the key accessibility features that people with disabilities require. And the financial wherewithal of older Americans to install those features or modify their houses themselves will be limited.
More than nine million older homeowners have less than $50,000 in non-housing assets. “Clearly, costs will pose challenges for many who will need to secure paid help to remain in their homes,” says the Joint Center. Renters’ assets are even more meager.
In the future, more women will be eligible for Social Security. But the Social Security Administration’s MINT (Modeling Incomes in the Near Term) model projects the share of all older adults having the means to maintain their pre-retirement lifestyle after they retire falling from 43% today to 39% in 2035. These trends together suggest a future widening in income distributions among older adults.
Households that pay more than half their income for housing costs are projected to reach 8.6 million by 2035. For both owners and renters, the numbers of severely cost-burdened households aged 80 and over will more than double.
In light of these trends and projections, the Joint Center recommends the following actions to ensure housing that provides adequate quality of life for an aging population:
•Increase accessible housing.
•Assist older owners with housing cost burdens.
•Increase subsidies to older renters.
•Strengthen ties between health care and housing.
•Increase public awareness.
•Expand housing options.
Related Stories

Market Data | Apr 11, 2023
Construction crane count reaches all-time high in Q1 2023
Toronto, Seattle, Los Angeles, and Denver top the list of U.S/Canadian cities with the greatest number of fixed cranes on construction sites, according to Rider Levett Bucknall's RLB Crane Index for North America for Q1 2023.

Contractors | Apr 11, 2023
The average U.S. contractor has 8.7 months worth of construction work in the pipeline, as of March 2023
Associated Builders and Contractors reported that its Construction Backlog Indicator declined to 8.7 months in March, according to an ABC member survey conducted March 20 to April 3. The reading is 0.4 months higher than in March 2022.

Market Data | Apr 6, 2023
JLL’s 2023 Construction Outlook foresees growth tempered by cost increases
The easing of supply chain snags for some product categories, and the dispensing with global COVID measures, have returned the North American construction sector to a sense of normal. However, that return is proving to be complicated, with the construction industry remaining exceptionally busy at a time when labor and materials cost inflation continues to put pricing pressure on projects, leading to caution in anticipation of a possible downturn. That’s the prognosis of JLL’s just-released 2023 U.S. and Canada Construction Outlook.

Market Data | Apr 4, 2023
Nonresidential construction spending up 0.4% in February 2023
National nonresidential construction spending increased 0.4% in February, according to an Associated Builders and Contractors analysis of data published by the U.S. Census Bureau. On a seasonally adjusted annualized basis, nonresidential spending totaled $982.2 billion for the month, up 16.8% from the previous year.

Multifamily Housing | Mar 24, 2023
Average size of new apartments dropped sharply in 2022
The average size of new apartments in 2022 dropped sharply in 2022, as tracked by RentCafe. Across the U.S., the average new apartment size was 887 sf, down 30 sf from 2021, which was the largest year-over-year decrease.

Multifamily Housing | Mar 14, 2023
Multifamily housing rent rates remain flat in February 2023
Multifamily housing asking rents remained the same for a second straight month in February 2023, at a national average rate of $1,702, according to the new National Multifamily Report from Yardi Matrix. As the economy continues to adjust in the post-pandemic period, year-over-year growth continued its ongoing decline.

Contractors | Mar 14, 2023
The average U.S. contractor has 9.2 months worth of construction work in the pipeline, as of February 2023
Associated Builders and Contractors reported today that its Construction Backlog Indicator increased to 9.2 months in February, according to an ABC member survey conducted Feb. 20 to March 6. The reading is 1.2 months higher than in February 2022.

Industry Research | Mar 9, 2023
Construction labor gap worsens amid more funding for new infrastructure, commercial projects
The U.S. construction industry needs to attract an estimated 546,000 additional workers on top of the normal pace of hiring in 2023 to meet demand for labor, according to a model developed by Associated Builders and Contractors. The construction industry averaged more than 390,000 job openings per month in 2022.

Market Data | Mar 7, 2023
AEC employees are staying with firms that invest in their brand
Hinge Marketing’s latest survey explores workers’ reasons for leaving, and offers strategies to keep them in the fold.

Multifamily Housing | Feb 21, 2023
Multifamily housing investors favoring properties in the Sun Belt
Multifamily housing investors are gravitating toward Sun Belt markets with strong job and population growth, according to new research from Yardi Matrix. Despite a sharp second-half slowdown, last year’s nationwide $187 billion transaction volume was the second-highest annual total ever.


