

Nationally, the average cost to build out an office is $196.49/sf. But after taking into account the average landlord-provided tenant-improvement allowance of $43.61/sf, the out-of-pocket cost for tenants is $152.88/sf, according to JLL’s new U.S. Fit Out Guide.
The report combines fitout costs and tenant improvement allowances to paint a comprehensive picture of what companies can expect to pay out of pocket for an office buildout across the nation. It also details the most- and least-expensive markets for fitouts.
Coming out on top as the most expensive market to build out an office is Silicon Valley, Calif., with an out-of-pocket cost of $199.22. The most affordable market: Washington, D.C., at $103.88.
“It’s no surprise that the Northwest continues to be the most expensive region for office builds,” says Mason Mularoni, Senior Research Analyst, JLL Project and Development Services. Southern cities claimed six out of the 10 most affordable markets.
Due to the range of landlord-provided tenant improvement packages, some cities that made the top lists were pretty unexpected.
 Silicon Valley, Calif., is the most expensive market for office fitout projects, with an average out-of-pocket cost of $199.22/sf, according to JLL.
Washington, D.C.: most affordable. Often topping most-expensive lists, the District of Columbia is officially the most inexpensive market to build out an office space. As the federal government, contractors, and law firms continue to consolidate, slightly below-average buildout costs are offset by record-high concession packages from landlords who are desperate to get tenants into the exploding mass of available space.
Detroit: eighth most expensive. Once on the brink of financial collapse, the Motor City is being reinvigorated by an eager tech community. Startups, investors, and outside firms are attracted to the Motor City’s resolve to bounce back.
But Detroit isn’t in the clear just yet. Due to above-average buildout costs and minimal TI packages, the city swings in as one of the top out-of-pocket cost markets.
Los Angeles: sixth most affordable market to build out an office. New leasing activity has been nourished by the convergence of media, technology, and entertainment. The tech sector in particular has shown a preference for creative buildouts. LA’s enormous TI packages are tied with Washington, D.C., for largest in the nation, offering an affordable option in the notoriously expensive state.
Long Island, N.Y.: third most expensive, beating out traditional frontrunner New York City. When it comes to building costs alone, New York City tops the list. But substantial TI packages in the city allow Long Island to slide ahead in out-of-pocket costs, holding its own against the expensive Northern California cities.
Seattle: seventh most affordable. Although the Northwest region tops the most expensive list, Seattle is the exception to the rule. Technology continues to be the primary factor of the city, and significant growth is occurring from local companies as well as from tenants migrating from the Bay Area.
The second-largest TI package average across the nation enables Seattle to hold down seventh place in most-affordable-city honors.
Related Stories
Market Data | Dec 2, 2020
Nonresidential construction spending remains flat in October
Residential construction expands as many commercial projects languish.
Market Data | Nov 30, 2020
New FEMA study projects implementing I-Codes could save $600 billion by 2060
International Code Council and FLASH celebrate the most comprehensive study conducted around hazard-resilient building codes to-date.
Market Data | Nov 23, 2020
Construction employment is down in three-fourths of states since February
This news comes even after 36 states added construction jobs in October.

Market Data | Nov 18, 2020
Architecture billings remained stalled in October
The pace of decline during October remained at about the same level as in September.

Market Data | Nov 17, 2020
Architects face data, culture gaps in fighting climate change
New study outlines how building product manufacturers can best support architects in climate action.

Market Data | Nov 10, 2020
Construction association ready to work with president-elect Biden to prepare significant new infrastructure and recovery measures
Incoming president and congress should focus on enacting measures to rebuild infrastructure and revive the economy.

Market Data | Nov 9, 2020
Construction sector adds 84,000 workers in October
A growing number of project cancellations risks undermining future industry job gains.
Market Data | Nov 4, 2020
Drop in nonresidential construction offsets most residential spending gains as growing number of contractors report cancelled projects
Association officials warn that demand for nonresidential construction will slide further without new federal relief measures.
Market Data | Nov 2, 2020
Nonresidential construction spending declines further in September
Among the sixteen nonresidential subcategories, thirteen were down on a monthly basis.
Market Data | Nov 2, 2020
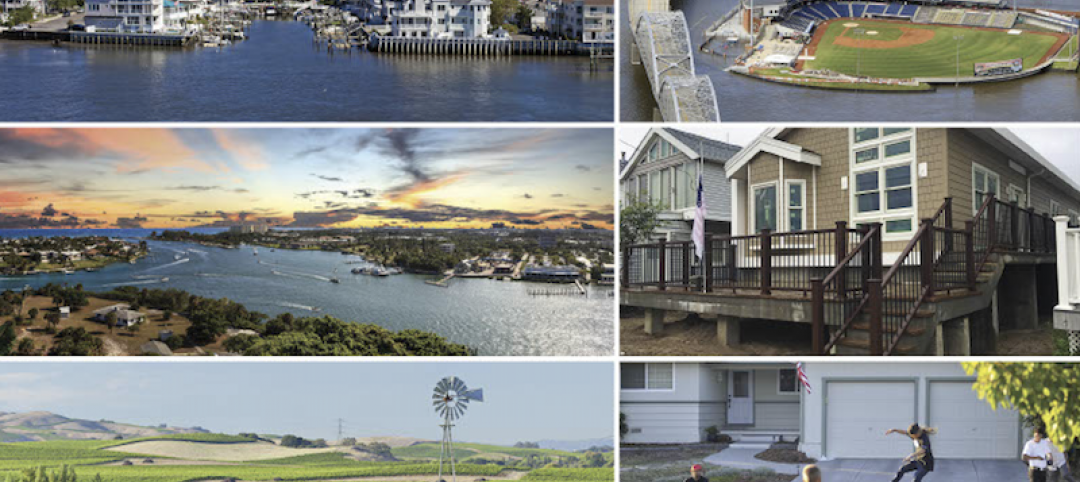
A white paper assesses seniors’ access to livable communities
The Joint Center for Housing Studies and AARP’s Public Policy Institute connect livability with income, race, and housing costs.


