

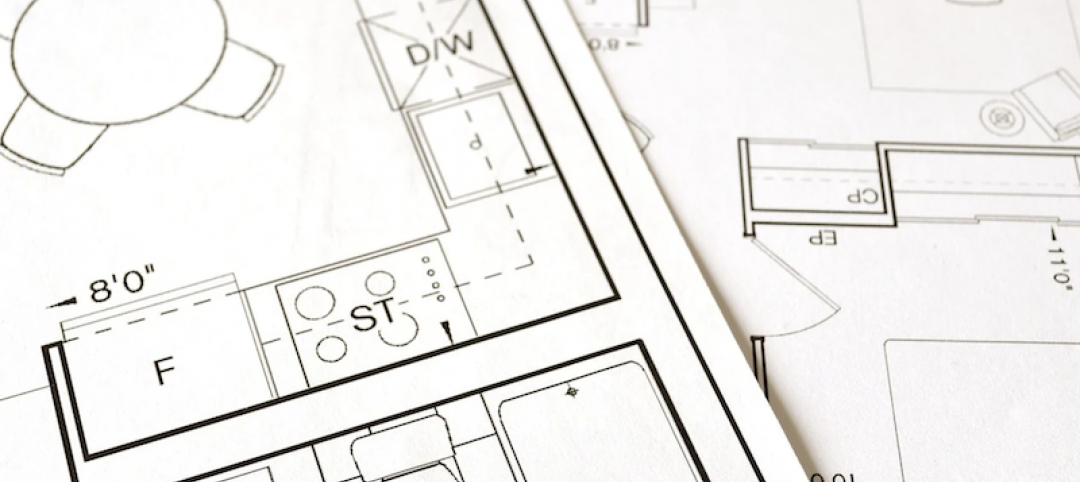
Nationally, the average cost to build out an office is $196.49/sf. But after taking into account the average landlord-provided tenant-improvement allowance of $43.61/sf, the out-of-pocket cost for tenants is $152.88/sf, according to JLL’s new U.S. Fit Out Guide.
The report combines fitout costs and tenant improvement allowances to paint a comprehensive picture of what companies can expect to pay out of pocket for an office buildout across the nation. It also details the most- and least-expensive markets for fitouts.
Coming out on top as the most expensive market to build out an office is Silicon Valley, Calif., with an out-of-pocket cost of $199.22. The most affordable market: Washington, D.C., at $103.88.
“It’s no surprise that the Northwest continues to be the most expensive region for office builds,” says Mason Mularoni, Senior Research Analyst, JLL Project and Development Services. Southern cities claimed six out of the 10 most affordable markets.
Due to the range of landlord-provided tenant improvement packages, some cities that made the top lists were pretty unexpected.
 Silicon Valley, Calif., is the most expensive market for office fitout projects, with an average out-of-pocket cost of $199.22/sf, according to JLL.
Washington, D.C.: most affordable. Often topping most-expensive lists, the District of Columbia is officially the most inexpensive market to build out an office space. As the federal government, contractors, and law firms continue to consolidate, slightly below-average buildout costs are offset by record-high concession packages from landlords who are desperate to get tenants into the exploding mass of available space.
Detroit: eighth most expensive. Once on the brink of financial collapse, the Motor City is being reinvigorated by an eager tech community. Startups, investors, and outside firms are attracted to the Motor City’s resolve to bounce back.
But Detroit isn’t in the clear just yet. Due to above-average buildout costs and minimal TI packages, the city swings in as one of the top out-of-pocket cost markets.
Los Angeles: sixth most affordable market to build out an office. New leasing activity has been nourished by the convergence of media, technology, and entertainment. The tech sector in particular has shown a preference for creative buildouts. LA’s enormous TI packages are tied with Washington, D.C., for largest in the nation, offering an affordable option in the notoriously expensive state.
Long Island, N.Y.: third most expensive, beating out traditional frontrunner New York City. When it comes to building costs alone, New York City tops the list. But substantial TI packages in the city allow Long Island to slide ahead in out-of-pocket costs, holding its own against the expensive Northern California cities.
Seattle: seventh most affordable. Although the Northwest region tops the most expensive list, Seattle is the exception to the rule. Technology continues to be the primary factor of the city, and significant growth is occurring from local companies as well as from tenants migrating from the Bay Area.
The second-largest TI package average across the nation enables Seattle to hold down seventh place in most-affordable-city honors.
Related Stories
Market Data | Jan 5, 2021
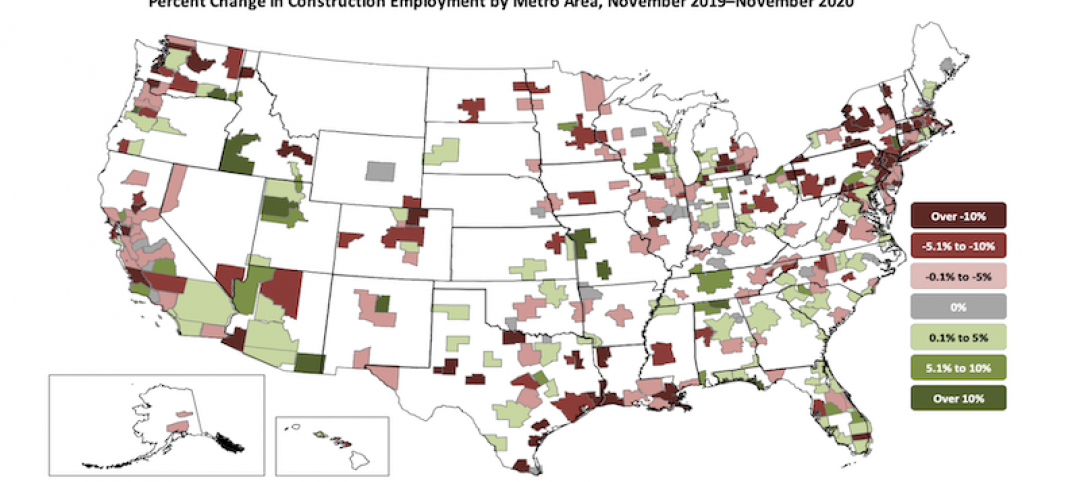
Barely one-third of metros add construction jobs in latest 12 months
Dwindling list of project starts forces contractors to lay off workers.
Market Data | Jan 4, 2021
Nonresidential construction spending shrinks further in November
Many commercial projects languish, even while homebuilding soars.
Market Data | Dec 29, 2020
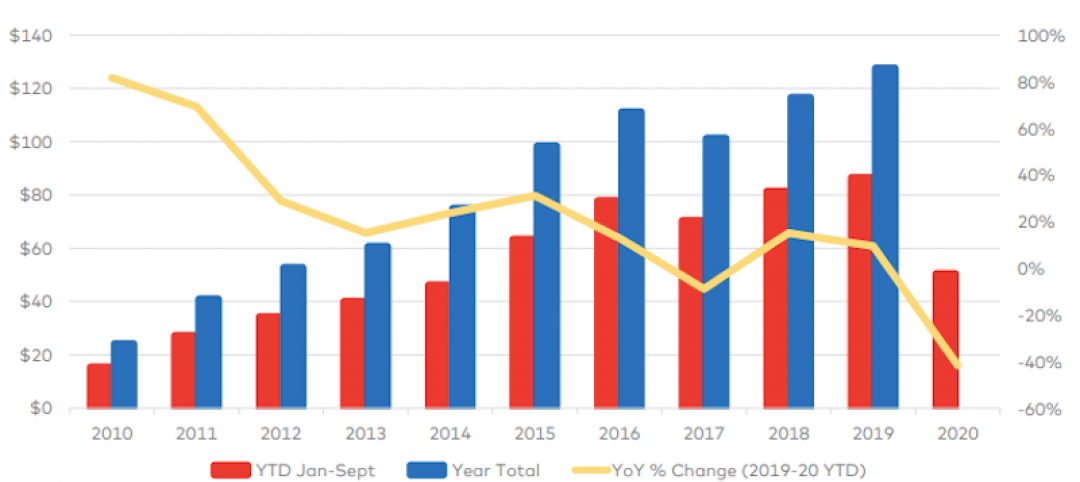
Multifamily transactions drop sharply in 2020, according to special report from Yardi Matrix
Sales completions at end of Q3 were down over 41 percent from the same period a year ago.

Market Data | Dec 28, 2020
New coronavirus recovery measure will provide some needed relief for contractors coping with project cancellations, falling demand
Measure’s modest amount of funding for infrastructure projects and clarification that PPP loans may not be taxed will help offset some of the challenges facing the construction industry.

Market Data | Dec 28, 2020
Construction employment trails pre-pandemic levels in 35 states despite gains in industry jobs from October to November in 31 states
New York and Vermont record worst February-November losses, Virginia has largest pickup.
Market Data | Dec 16, 2020
Architecture billings lose ground in November
The pace of decline during November accelerated from October, posting an Architecture Billings Index (ABI) score of 46.3 from 47.5.

AEC Tech | Dec 8, 2020
COVID-19 affects the industry’s adoption of ConTech in different ways
A new JLL report assesses which tech options got a pandemic “boost.”
Market Data | Dec 7, 2020
Construction sector adds 27,000 jobs in November
Project cancellations, looming PPP tax bill will undercut future job gains.

Market Data | Dec 3, 2020
Only 30% of metro areas add construction jobs in latest 12 months
Widespread project postponements and cancellations force layoffs.

Market Data | Dec 2, 2020
New Passive House standards offers prescriptive path that reduces costs
Eliminates requirement for a Passive House consultant and attendant modeling.


