

Nationally, the average cost to build out an office is $196.49/sf. But after taking into account the average landlord-provided tenant-improvement allowance of $43.61/sf, the out-of-pocket cost for tenants is $152.88/sf, according to JLL’s new U.S. Fit Out Guide.
The report combines fitout costs and tenant improvement allowances to paint a comprehensive picture of what companies can expect to pay out of pocket for an office buildout across the nation. It also details the most- and least-expensive markets for fitouts.
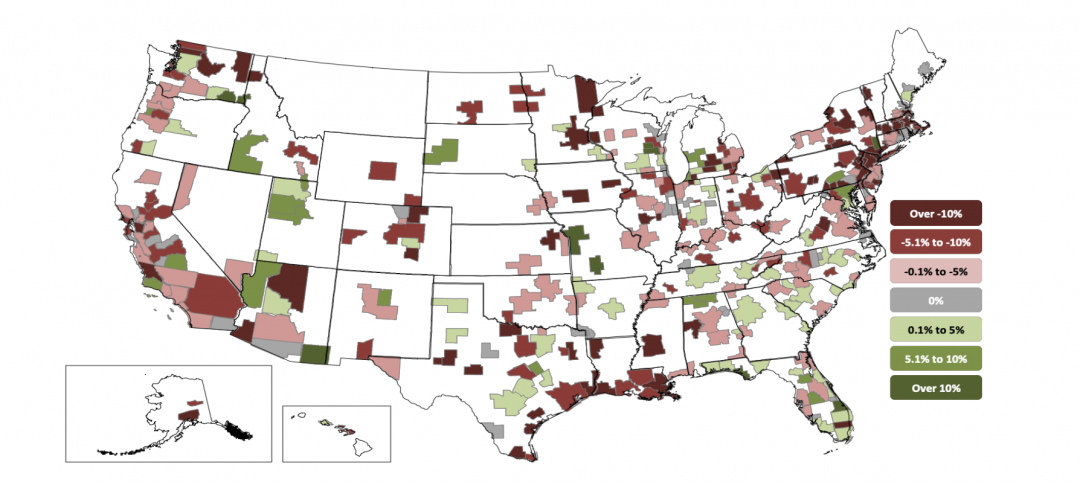
Coming out on top as the most expensive market to build out an office is Silicon Valley, Calif., with an out-of-pocket cost of $199.22. The most affordable market: Washington, D.C., at $103.88.
“It’s no surprise that the Northwest continues to be the most expensive region for office builds,” says Mason Mularoni, Senior Research Analyst, JLL Project and Development Services. Southern cities claimed six out of the 10 most affordable markets.
Due to the range of landlord-provided tenant improvement packages, some cities that made the top lists were pretty unexpected.
 Silicon Valley, Calif., is the most expensive market for office fitout projects, with an average out-of-pocket cost of $199.22/sf, according to JLL.
Washington, D.C.: most affordable. Often topping most-expensive lists, the District of Columbia is officially the most inexpensive market to build out an office space. As the federal government, contractors, and law firms continue to consolidate, slightly below-average buildout costs are offset by record-high concession packages from landlords who are desperate to get tenants into the exploding mass of available space.
Detroit: eighth most expensive. Once on the brink of financial collapse, the Motor City is being reinvigorated by an eager tech community. Startups, investors, and outside firms are attracted to the Motor City’s resolve to bounce back.
But Detroit isn’t in the clear just yet. Due to above-average buildout costs and minimal TI packages, the city swings in as one of the top out-of-pocket cost markets.
Los Angeles: sixth most affordable market to build out an office. New leasing activity has been nourished by the convergence of media, technology, and entertainment. The tech sector in particular has shown a preference for creative buildouts. LA’s enormous TI packages are tied with Washington, D.C., for largest in the nation, offering an affordable option in the notoriously expensive state.
Long Island, N.Y.: third most expensive, beating out traditional frontrunner New York City. When it comes to building costs alone, New York City tops the list. But substantial TI packages in the city allow Long Island to slide ahead in out-of-pocket costs, holding its own against the expensive Northern California cities.
Seattle: seventh most affordable. Although the Northwest region tops the most expensive list, Seattle is the exception to the rule. Technology continues to be the primary factor of the city, and significant growth is occurring from local companies as well as from tenants migrating from the Bay Area.
The second-largest TI package average across the nation enables Seattle to hold down seventh place in most-affordable-city honors.
Related Stories
Market Data | Nov 2, 2020
More contractors report canceled projects than starts, survey finds
Construction employment declined in most metros in latest 12 months.

Multifamily Housing | Oct 30, 2020
The Weekly show: Multifamily security tips, the state of construction industry research, and AGC's market update
BD+C editors speak with experts from AGC, Charles Pankow Foundation, and Silva Consultants on the October 29 episode of "The Weekly." The episode is available for viewing on demand.

Hotel Facilities | Oct 27, 2020
Hotel construction pipeline dips 7% in Q3 2020
Hospitality developers continue to closely monitor the impact the coronavirus will have on travel demand, according to Lodging Econometrics.
Market Data | Oct 22, 2020
Multifamily’s long-term outlook rebounds to pre-covid levels in Q3
Slump was a short one for multifamily market as 3rd quarter proposal activity soars.

Market Data | Oct 21, 2020
Architectural billings slowdown moderated in September
AIA’s ABI score for September was 47.0 compared to 40.0 in August.
Market Data | Oct 21, 2020
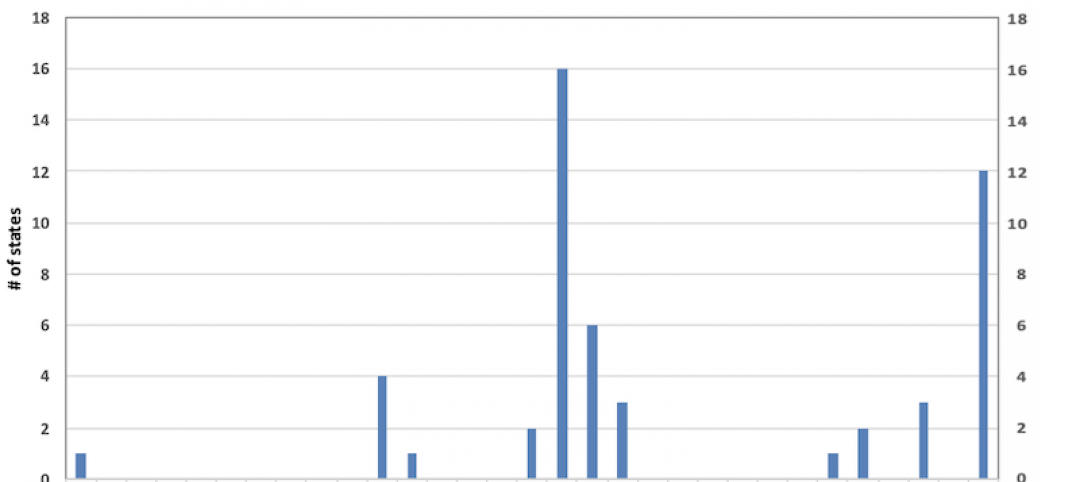
Only eight states top February peak construction employment despite gains in 32 states last month
California and Vermont post worst losses since February as Virginia and South Dakota add the most.

Market Data | Oct 20, 2020
AIA releases updated contracts for multi-family residential and prototype residential projects
New resources provide insights into mitigating and managing risk on complex residential design and construction projects.

Market Data | Oct 20, 2020
Construction officials call on Trump and Biden to establish a nationwide vaccine distribution plan to avoid confusion and delays
Officials say nationwide plan should set clear distribution priorities.
Market Data | Oct 19, 2020
5 must reads for the AEC industry today: October 19, 2020
Lower cost metros outperform pricey gateway markets and E-commerce fuels industrial's unstoppable engine.

Market Data | Oct 19, 2020
Lower-cost metros continue to outperform pricey gateway markets, Yardi Matrix reports
But year-over-year multifamily trendline remained negative at -0.3%, unchanged from July.


