


The Building Owners and Managers Association (BOMA) International has identified the most expensive commercial real estate markets in the U.S. The data is drawn from the 2011 Experience Exchange Report (EER), which provides an annual analysis of the office building operating income and expense data compiled across approximately 940 million square feet of commercial office space in more than 6,500 buildings in 278 different markets. The 2011 report is based on operating income and expenses from 2010.
The most expensive U.S. cities, based on total rental income, include:
- New York, N.Y., $48.27 per square foot (psf)
- Washington, D.C., $42.63 psf
- San Mateo, Calif., $41.61 psf
- Santa Monica, Calif., $36.67 psf
- San Francisco, Calif., $34.86 psf
- Boston, Mass., $31.15 psf
- San Jose, Calif., $30.35 psf
- Los Angeles, Calif., $27.97 psf
- West Palm Beach, Fla., $27.71 psf
- Chicago, Ill., $25.20 psf
Total rental income includes rental income from office, retail, and other space, which includes storage areas. Amid the economic downturn in real estate markets, few markets demonstrated significant increases in rental income, suggesting that rental rates remain relatively stable and favorable for tenants seeking to pursue new leases or renegotiate existing ones. Among the most expensive cities, only New York and San Francisco showed increases in rental income.
Gauging most expensive cities on the basis of total operating and fixed expenses produces a slightly different list:
- New York, N.Y., $21.44 psf
- Washington, D.C., $16.86 psf
- Boston, Mass., $15.16 psf
- Morristown, N.J., $14.67 psf
- San Francisco, Calif., $14.43 psf
- Miami, Fla., $12.87 psf
- Santa Monica, Calif., $12.84 psf
- Plainfield, N.J., $12.83 psf
- Chicago, Ill. and Los Angeles, Calif., 12.49 psf
- Newark, N.J., $12.46 psf
Total operating expenses includes all expenses incurred to operate office buildings, including utilities, repairs/maintenance, cleaning, administrative, security and roads and grounds. Fixed expenses include real estate taxes, property taxes and insurance. In New York, average total operating plus fixed expenses were $21.44 per square foot (psf), while in Los Angeles, they averaged $12.96 psf. Operating expenses increased in most markets in the last year. Fixed expenses were volatile, which could be attributed in part to rising utility costs as well as rising real estate taxes. While many cash-constrained cities and municipalities are looking to real estate for tax revenue, many property owners are contesting tax assessments because asset values have decreased due to the economic downturn. BD+C
Related Stories

Airports | Jan 30, 2024
Rafael Viñoly Architects’ design for the new Florence, Italy, airport terminal will feature a rooftop vineyard
At Florence, Italy’s Aeroporto Amerigo Vespucci, the new international airport terminal will feature a fully operating vineyard on the facility’s rooftop. Designed by Rafael Viñoly Architects, the terminal is expected to see over 5.9 million passengers annually. Renderings for the project have recently been released.

Giants 400 | Jan 29, 2024
Top 160 Workplace Interior Architecture Firms for 2023
Gensler, Interior Architects, HOK, SmithGroup, and Perkins&Will top BD+C's ranking of the nation's largest workplace interior and interior fitout architecture and architecture engineering (AE) firms for 2023, as reported in the 2023 Giants 400 Report.

Mixed-Use | Jan 29, 2024
12 U.S. markets where entertainment districts are under consideration or construction
The Pomp, a 223-acre district located 10 miles north of Fort Lauderdale, Fla., and The Armory, a 225,000-sf dining and entertainment venue on six acres in St Louis, are among the top entertainment districts in the works across the U.S.

Laboratories | Jan 25, 2024
Tactical issues for renovating university research buildings
Matthew Plecity, AIA, ASLA, Principal, GBBN, highlights the connection between the built environment and laboratory research, and weighs the benefits of renovation vs. new construction.

K-12 Schools | Jan 25, 2024
Video: Research-based design for K-12 schools
Two experts from national architecture firm PBK discuss how behavioral research is benefiting the design of K-12 schools in Texas, Florida, and other states. Dan Boggio, AIA, LEED AP, NCARB, Founder & Executive Chair, PBK, and Melissa Turnbaugh, AIA, NCARB, Partner & National Education & Innovation Leader, PBK, speak with Robert Cassidy, Executive Editor, Building Design+Construction.

Women in Design+Construction | Jan 25, 2024
40 Under 40 Class of 2023 winner Kimberly Dowdell inaugurated as AIA 2024 President
The American Institute of Architects (AIA) has announced the inauguration of Kimberly Dowdell, AIA, NOMAC, NCARB, LEED AP BD+C, Principal and Director of Strategic Relationships at HOK and BD+C 40 Under 40 superstar, as its 100th president.
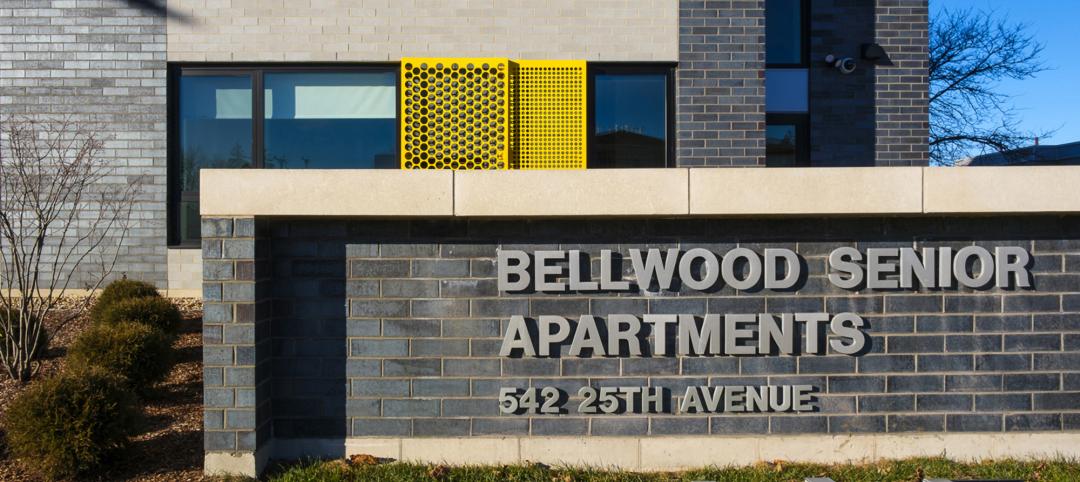
Senior Living Design | Jan 24, 2024
Former Walgreens becomes affordable senior living community
Evergreen Real Estate Group has announced the completion of Bellwood Senior Apartments. The 80-unit senior living community at 542 25th Ave. in Bellwood, Ill., provides independent living options for low-income seniors.

AEC Tech | Jan 24, 2024
4 ways AEC firms can benefit from digital transformation
While going digital might seem like a playground solely for industry giants, the truth is that any company can benefit from the power of technology.

Giants 400 | Jan 23, 2024
Top 60 Parking Structure Architecture Firms for 2023
Choate Parking Consultants, Page Southerland Page, Gensler, AO, and Elkus Manfredi Architects top BD+C's ranking of the nation's largest parking structure architecture and architecture engineering (AE) firms for 2023, as reported in the 2023 Giants 400 Report.

Industry Research | Jan 23, 2024
Leading economists forecast 4% growth in construction spending for nonresidential buildings in 2024
Spending on nonresidential buildings will see a modest 4% increase in 2024, after increasing by more than 20% last year according to The American Institute of Architects’ latest Consensus Construction Forecast. The pace will slow to just over 1% growth in 2025, a marked difference from the strong performance in 2023.


