


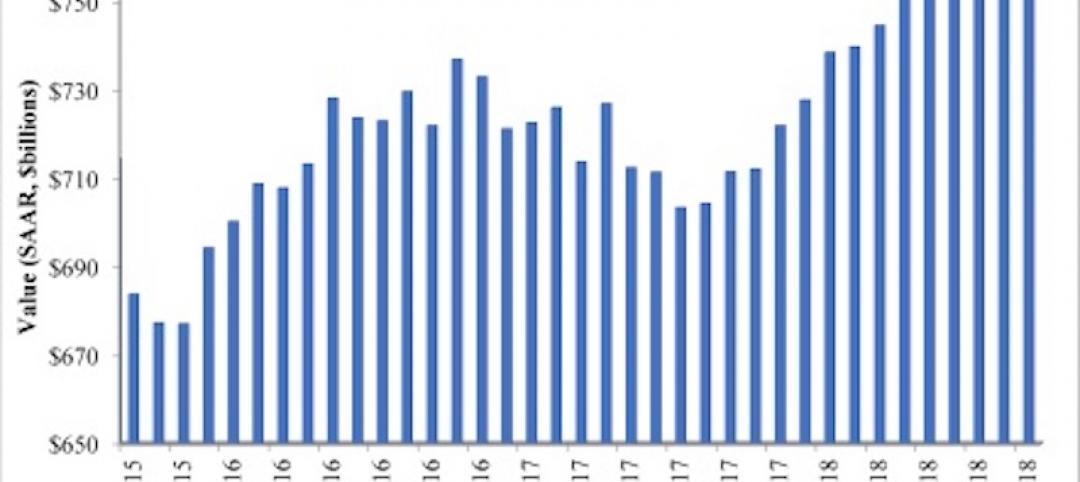
Nonresidential construction spending fell 1.7% in April 2017, totaling $696.3 billion on a seasonally adjusted, annualized basis, according to analysis of U.S. Census Bureau data released today by Associated Builders and Contractors (ABC).
In April, private nonresidential construction spending fell 0.6% for the month, but has increased 4.3% on a year-ago basis. Public nonresidential spending decreased by 3.4% and is down 4.2 % year-over-year. Declines in nonresidential construction spending for the month were largely attributable to drops in spending in the highway and street and power segments, down $3.5 billion and $2.1 billion, respectively.
“A staggering 13 of 16 nonresidential construction segments experienced spending declines in April,” said ABC Chief Economist Anirban Basu. “While poor weather interrupted a considerable amount of economic activity in the Northeast in March—which produced March’s weak jobs report, among other things—weather generally improved in April. This would normally suggest expansion in nonresidential construction spending in on a monthly basis; however, that is not reflected in the April data.
“Instead, public nonresidential construction spending continued to demonstrate substantial weakness with one noteworthy exception, water supply, which produced a small increase,” said Basu. “Among the private categories only office, which was flat, and commercial, which sustained only a small monthly decline, reported stable spending amounts. Both categories have seen a year-over-year spending expansion of 12.4%.
“There are a number of explanatory factors,” said Basu. “First, there are survey data from the Federal Reserve indicating that bank lending to commercial real estate has begun to tighten, perhaps because of growing fears of overbuilding in certain markets. Uncertainty at the federal agency level is also likely having an impact, including in public segments like highway and street that depend heavily on federal outlays. Finally, certain economic decision-makers may have ratcheted down their projections of economic growth in 2017 and 2018, resulting in more hesitation with respect to moving forward with projects at various stages of development.”
February’s initial estimate, which was revised higher last month, was revised lower this month. The revision translates into a decline of $9.6 billion, or 1.3%. March’s value was relatively unchanged at around $708.6 billion.
Related Stories

Market Data | Jan 16, 2019
AIA 2019 Consensus Forecast: Nonresidential construction spending to rise 4.4%
The education, public safety, and office sectors will lead the growth areas this year, but AIA's Kermit Baker offers a cautious outlook for 2020.

Market Data | Dec 19, 2018
Brokers look forward to a commercial real estate market that mirrors 2018’s solid results
Respondents to a recent Transwestern poll expect flat to modest growth for rents and investment in offices, MOBs, and industrial buildings.

Market Data | Dec 19, 2018
When it comes to economic clout, New York will far outpace other U.S. metros for decades to come
But San Jose, Calif., is expected to have the best annual growth rate through 2035, according to Oxford Economics’ latest Global Cities report.

Market Data | Dec 19, 2018
Run of positive billings continues at architecture firms
November marked the fourteenth consecutive month of increasing demand for architectural firm services.

Market Data | Dec 5, 2018
ABC predicts construction sector will remain strong in 2019
Job growth, high backlog and healthy infrastructure investment all spell good news for the industry.
Market Data | Dec 4, 2018
Nonresidential spending rises modestly in October
Thirteen out of 16 subsectors are associated with year-over-year increases.

Market Data | Nov 20, 2018
Construction employment rises from October 2017 to October 2018 in 44 states and D.C.
Texas has biggest annual job increase while New Jersey continues losses; Iowa, Florida and California have largest one-month gains as Mississippi and Louisiana trail.

Market Data | Nov 15, 2018
Architecture firm billings continue to slow, but remain positive in October
Southern region reports decline in billings for the first time since June 2012.
Market Data | Nov 14, 2018
A new Joint Center report finds aging Americans less prepared to afford housing
The study foresees a significant segment of seniors struggling to buy or rent on their own or with other people.

Market Data | Nov 12, 2018
Leading hotel markets in the U.S. construction pipeline
Projects already under construction and those scheduled to start construction in the next 12 months, combined, have a total of 3,782 projects/213,798 rooms and are at cyclical highs.


