


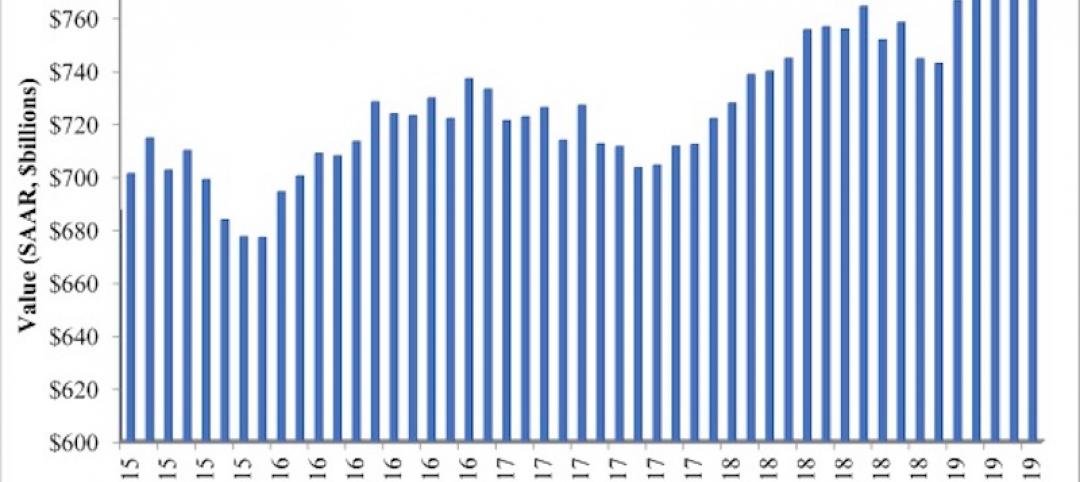
Nonresidential construction spending fell 1.7% in April 2017, totaling $696.3 billion on a seasonally adjusted, annualized basis, according to analysis of U.S. Census Bureau data released today by Associated Builders and Contractors (ABC).
In April, private nonresidential construction spending fell 0.6% for the month, but has increased 4.3% on a year-ago basis. Public nonresidential spending decreased by 3.4% and is down 4.2 % year-over-year. Declines in nonresidential construction spending for the month were largely attributable to drops in spending in the highway and street and power segments, down $3.5 billion and $2.1 billion, respectively.
“A staggering 13 of 16 nonresidential construction segments experienced spending declines in April,” said ABC Chief Economist Anirban Basu. “While poor weather interrupted a considerable amount of economic activity in the Northeast in March—which produced March’s weak jobs report, among other things—weather generally improved in April. This would normally suggest expansion in nonresidential construction spending in on a monthly basis; however, that is not reflected in the April data.
“Instead, public nonresidential construction spending continued to demonstrate substantial weakness with one noteworthy exception, water supply, which produced a small increase,” said Basu. “Among the private categories only office, which was flat, and commercial, which sustained only a small monthly decline, reported stable spending amounts. Both categories have seen a year-over-year spending expansion of 12.4%.
“There are a number of explanatory factors,” said Basu. “First, there are survey data from the Federal Reserve indicating that bank lending to commercial real estate has begun to tighten, perhaps because of growing fears of overbuilding in certain markets. Uncertainty at the federal agency level is also likely having an impact, including in public segments like highway and street that depend heavily on federal outlays. Finally, certain economic decision-makers may have ratcheted down their projections of economic growth in 2017 and 2018, resulting in more hesitation with respect to moving forward with projects at various stages of development.”
February’s initial estimate, which was revised higher last month, was revised lower this month. The revision translates into a decline of $9.6 billion, or 1.3%. March’s value was relatively unchanged at around $708.6 billion.
Related Stories

Market Data | Jul 31, 2019
For the second quarter of 2019, the U.S. hotel construction pipeline continued its year-over-year growth spurt
The growth spurt continued even as business investment declined for the first time since 2016.
Market Data | Jul 23, 2019
Despite signals of impending declines, continued growth in nonresidential construction is expected through 2020
AIA’s latest Consensus Construction Forecast predicts growth.
Market Data | Jul 20, 2019
Construction costs continued to rise in second quarter
Labor availability is a big factor in that inflation, according to Rider Levett Bucknall report.
Market Data | Jul 18, 2019
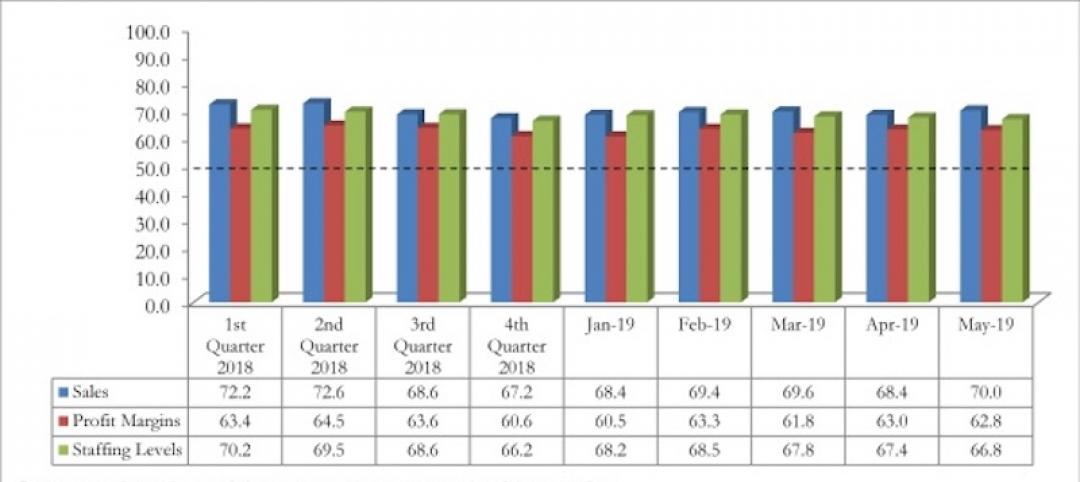
Construction contractors remain confident as summer begins
Contractors were slightly less upbeat regarding profit margins and staffing levels compared to April.
Market Data | Jul 17, 2019
Design services demand stalled in June
Project inquiry gains hit a 10-year low.
Market Data | Jul 16, 2019
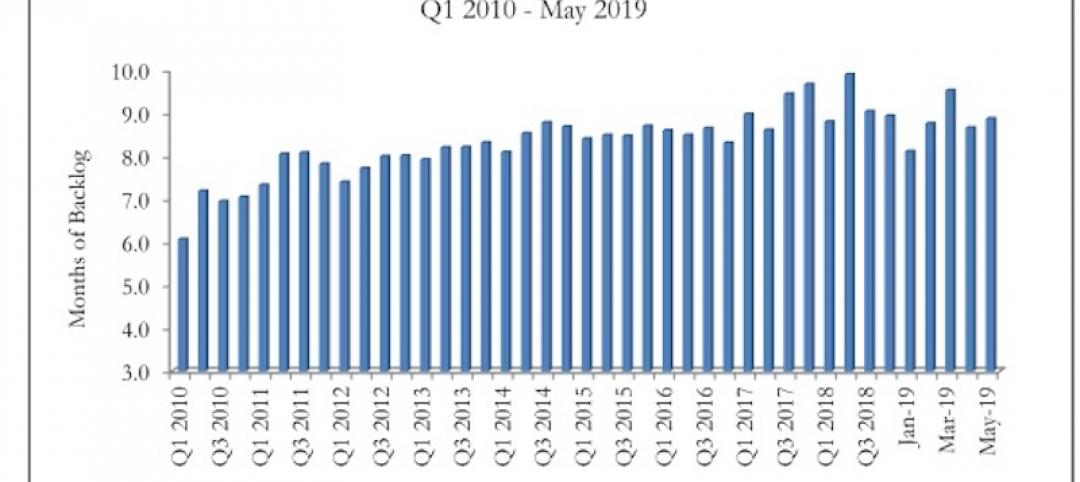
ABC’s Construction Backlog Indicator increases modestly in May
The Construction Backlog Indicator expanded to 8.9 months in May 2019.

K-12 Schools | Jul 15, 2019
Summer assignments: 2019 K-12 school construction costs
Using RSMeans data from Gordian, here are the most recent costs per square foot for K-12 school buildings in 10 cities across the U.S.
Market Data | Jul 12, 2019
Construction input prices plummet in June
This is the first time in nearly three years that input prices have fallen on a year-over-year basis.
Market Data | Jul 1, 2019
Nonresidential construction spending slips modestly in May
Among the 16 nonresidential construction spending categories tracked by the Census Bureau, five experienced increases in monthly spending.

Market Data | Jul 1, 2019
Almost 60% of the U.S. construction project pipeline value is concentrated in 10 major states
With a total of 1,302 projects worth $524.6 billion, California has both the largest number and value of projects in the U.S. construction project pipeline.


