


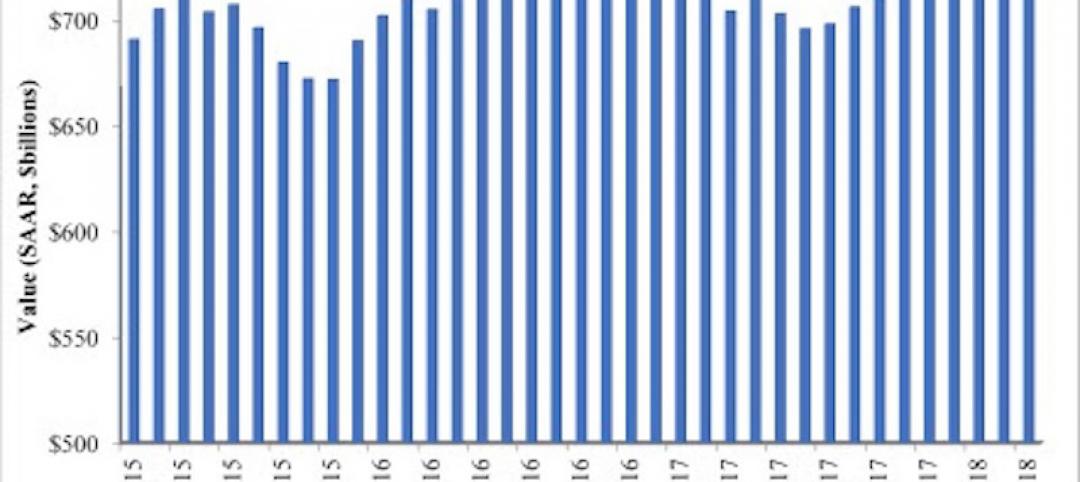
Nonresidential construction spending fell 1.7% in April 2017, totaling $696.3 billion on a seasonally adjusted, annualized basis, according to analysis of U.S. Census Bureau data released today by Associated Builders and Contractors (ABC).
In April, private nonresidential construction spending fell 0.6% for the month, but has increased 4.3% on a year-ago basis. Public nonresidential spending decreased by 3.4% and is down 4.2 % year-over-year. Declines in nonresidential construction spending for the month were largely attributable to drops in spending in the highway and street and power segments, down $3.5 billion and $2.1 billion, respectively.
“A staggering 13 of 16 nonresidential construction segments experienced spending declines in April,” said ABC Chief Economist Anirban Basu. “While poor weather interrupted a considerable amount of economic activity in the Northeast in March—which produced March’s weak jobs report, among other things—weather generally improved in April. This would normally suggest expansion in nonresidential construction spending in on a monthly basis; however, that is not reflected in the April data.
“Instead, public nonresidential construction spending continued to demonstrate substantial weakness with one noteworthy exception, water supply, which produced a small increase,” said Basu. “Among the private categories only office, which was flat, and commercial, which sustained only a small monthly decline, reported stable spending amounts. Both categories have seen a year-over-year spending expansion of 12.4%.
“There are a number of explanatory factors,” said Basu. “First, there are survey data from the Federal Reserve indicating that bank lending to commercial real estate has begun to tighten, perhaps because of growing fears of overbuilding in certain markets. Uncertainty at the federal agency level is also likely having an impact, including in public segments like highway and street that depend heavily on federal outlays. Finally, certain economic decision-makers may have ratcheted down their projections of economic growth in 2017 and 2018, resulting in more hesitation with respect to moving forward with projects at various stages of development.”
February’s initial estimate, which was revised higher last month, was revised lower this month. The revision translates into a decline of $9.6 billion, or 1.3%. March’s value was relatively unchanged at around $708.6 billion.
Related Stories

Market Data | Jun 20, 2018
7% year-over-year growth in the global construction pipeline
There are 5,952 projects/1,115,288 rooms under construction, up 8% by projects YOY.
Market Data | Jun 19, 2018
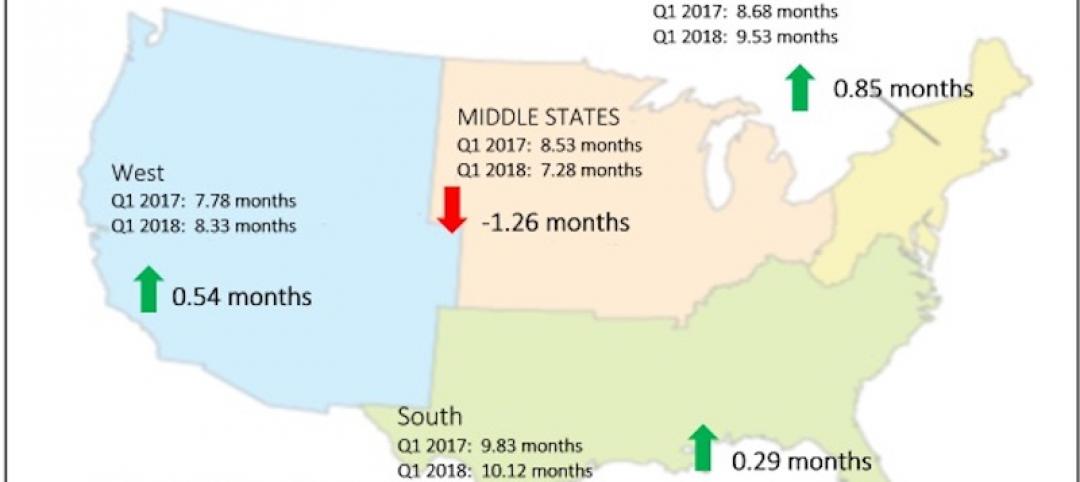
ABC’s Construction Backlog Indicator remains elevated in first quarter of 2018
The CBI shows highlights by region, industry, and company size.
Market Data | Jun 19, 2018
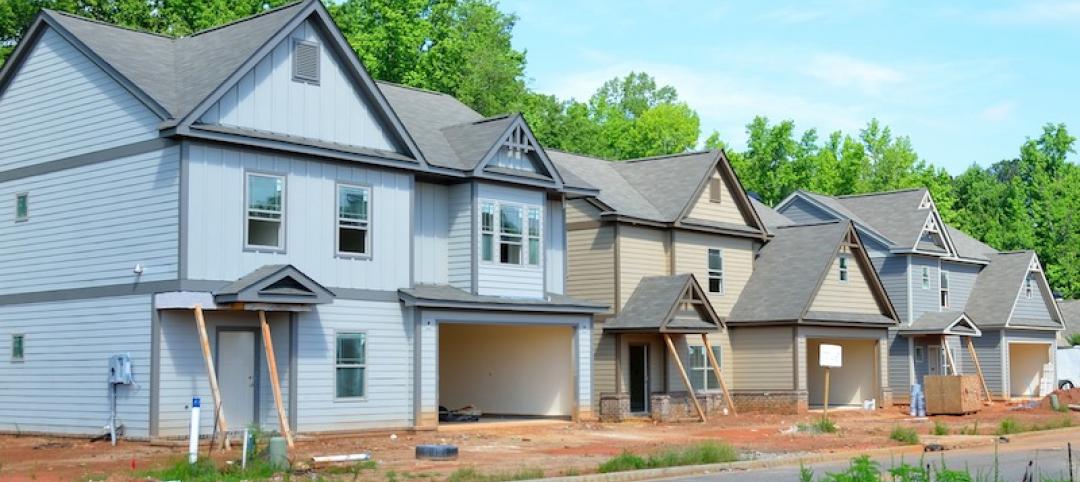
America’s housing market still falls short of providing affordable shelter to many
The latest report from the Joint Center for Housing Studies laments the paucity of subsidies to relieve cost burdens of ownership and renting.

Market Data | Jun 18, 2018
AI is the path to maximum profitability for retail and FMCG firms
Leading retailers including Amazon, Alibaba, Lowe’s and Tesco are developing their own AI solutions for automation, analytics and robotics use cases.

Market Data | Jun 12, 2018
Yardi Matrix report details industrial sector's strength
E-commerce and biopharmaceutical companies seeking space stoke record performances across key indicators.
Market Data | Jun 8, 2018
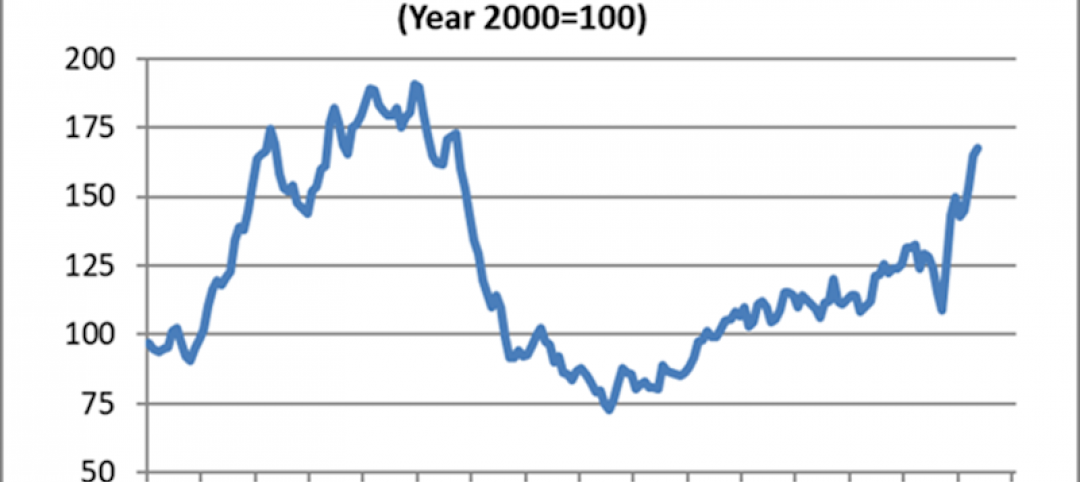
Dodge Momentum Index inches up in May
May’s gain was the result of a 4.7% increase by the commercial component of the Momentum Index.
Market Data | Jun 4, 2018
Nonresidential construction remains unchanged in April
Private sector spending increased 0.8% on a monthly basis and is up 5.3% from a year ago.
Market Data | May 30, 2018
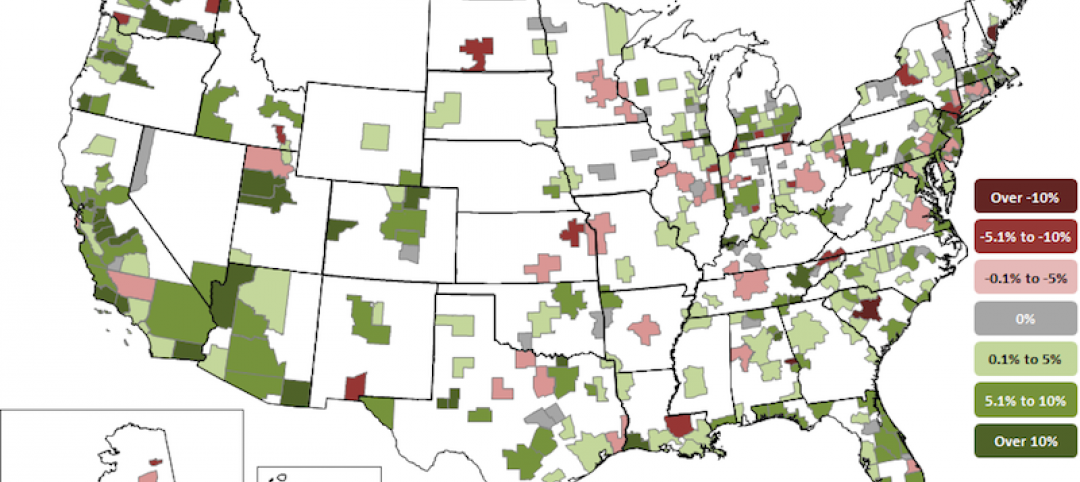
Construction employment increases in 256 metro areas between April 2017 & 2018
Dallas-Plano-Irving and Midland, Texas experience largest year-over-year gains; St. Louis, Mo.-Ill. and Bloomington, Ill. have biggest annual declines in construction employment amid continuing demand.

Market Data | May 29, 2018
America’s fastest-growing cities: San Antonio, Phoenix lead population growth
San Antonio added 24,208 people between July 2016 and July 2017, according to U.S. Census Bureau data.
Market Data | May 25, 2018
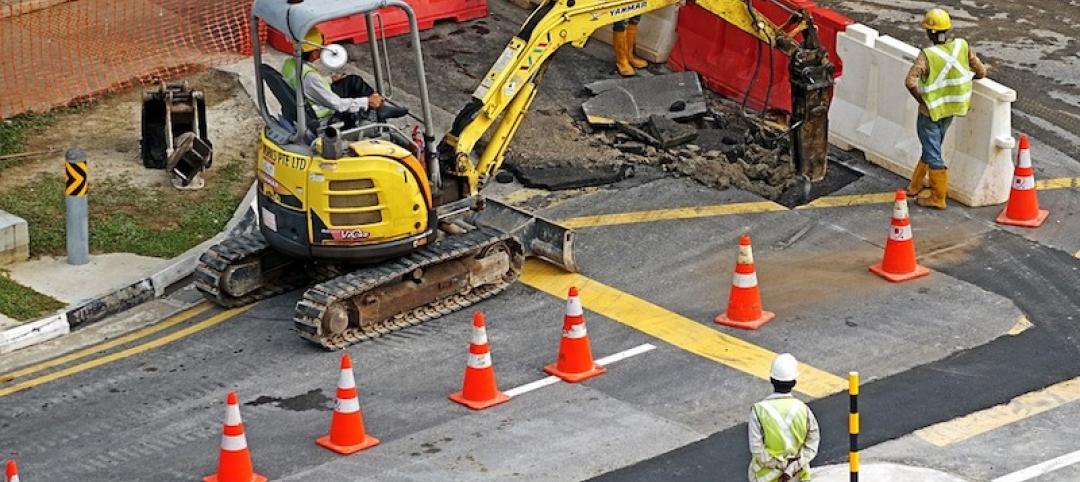
Construction group uses mobile technology to make highway work zones safer
Mobile advertising campaign urges drivers who routinely pass through certain work zones to slow down and be alert as new data shows motorists are more likely to be injured than construction workers.


