


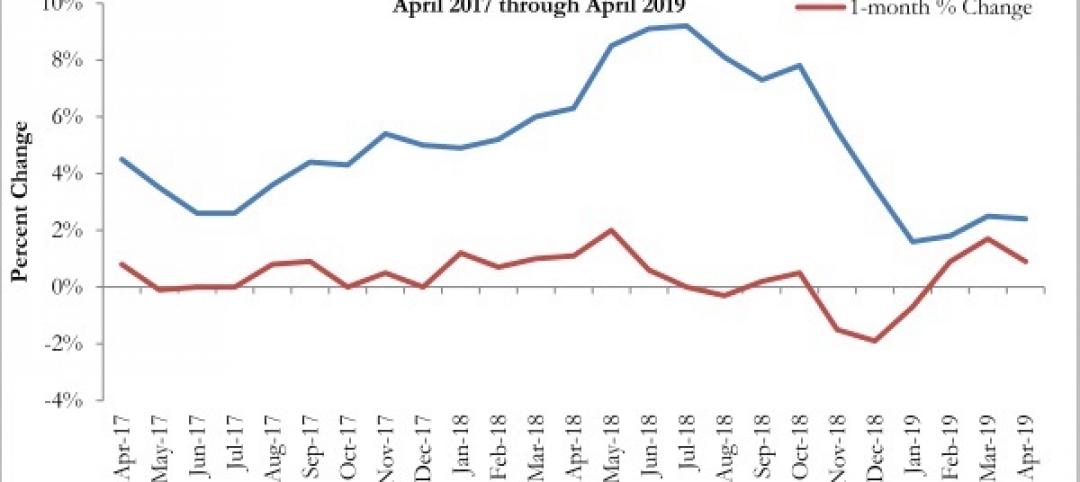
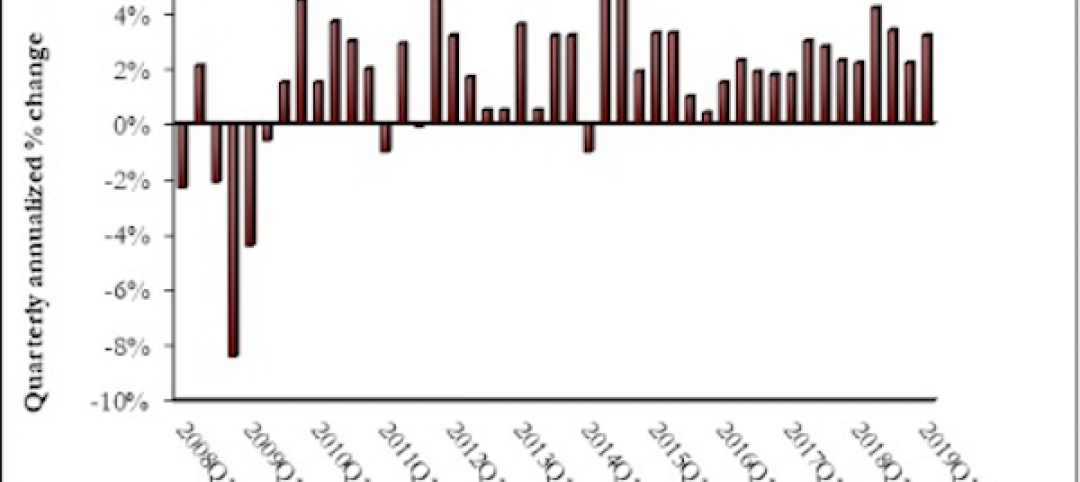
Nonresidential construction spending fell 1.7% in April 2017, totaling $696.3 billion on a seasonally adjusted, annualized basis, according to analysis of U.S. Census Bureau data released today by Associated Builders and Contractors (ABC).
In April, private nonresidential construction spending fell 0.6% for the month, but has increased 4.3% on a year-ago basis. Public nonresidential spending decreased by 3.4% and is down 4.2 % year-over-year. Declines in nonresidential construction spending for the month were largely attributable to drops in spending in the highway and street and power segments, down $3.5 billion and $2.1 billion, respectively.
“A staggering 13 of 16 nonresidential construction segments experienced spending declines in April,” said ABC Chief Economist Anirban Basu. “While poor weather interrupted a considerable amount of economic activity in the Northeast in March—which produced March’s weak jobs report, among other things—weather generally improved in April. This would normally suggest expansion in nonresidential construction spending in on a monthly basis; however, that is not reflected in the April data.
“Instead, public nonresidential construction spending continued to demonstrate substantial weakness with one noteworthy exception, water supply, which produced a small increase,” said Basu. “Among the private categories only office, which was flat, and commercial, which sustained only a small monthly decline, reported stable spending amounts. Both categories have seen a year-over-year spending expansion of 12.4%.
“There are a number of explanatory factors,” said Basu. “First, there are survey data from the Federal Reserve indicating that bank lending to commercial real estate has begun to tighten, perhaps because of growing fears of overbuilding in certain markets. Uncertainty at the federal agency level is also likely having an impact, including in public segments like highway and street that depend heavily on federal outlays. Finally, certain economic decision-makers may have ratcheted down their projections of economic growth in 2017 and 2018, resulting in more hesitation with respect to moving forward with projects at various stages of development.”
February’s initial estimate, which was revised higher last month, was revised lower this month. The revision translates into a decline of $9.6 billion, or 1.3%. March’s value was relatively unchanged at around $708.6 billion.
Related Stories
Market Data | Jun 12, 2019
Construction input prices see slight increase in May
Among the 11 subcategories, six saw prices fall last month, with the largest decreases in natural gas.

Market Data | Jun 3, 2019
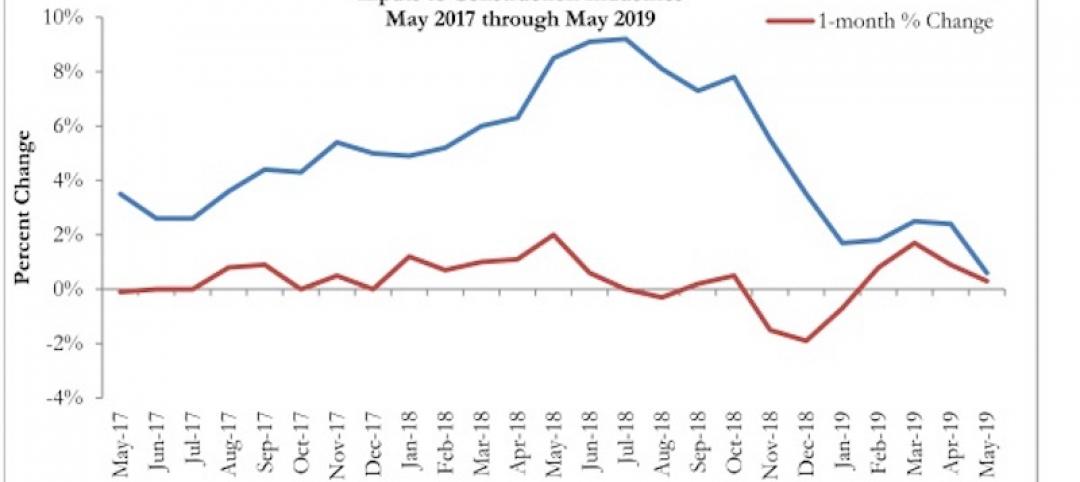
Nonresidential construction spending up 6.4% year over year in April
Among the 16 sectors tracked by the U.S. Census Bureau, nine experienced an increase in monthly spending, led by water supply and highway and street.

Market Data | Jun 3, 2019
4.1% annual growth in office asking rents above five-year compound annual growth rate
Market has experienced no change in office vacancy rates in three quarters.

Market Data | May 30, 2019
Construction employment increases in 250 out of 358 metros from April 2018 to April 2019
Demand for work is outpacing the supply of workers.
Market Data | May 24, 2019
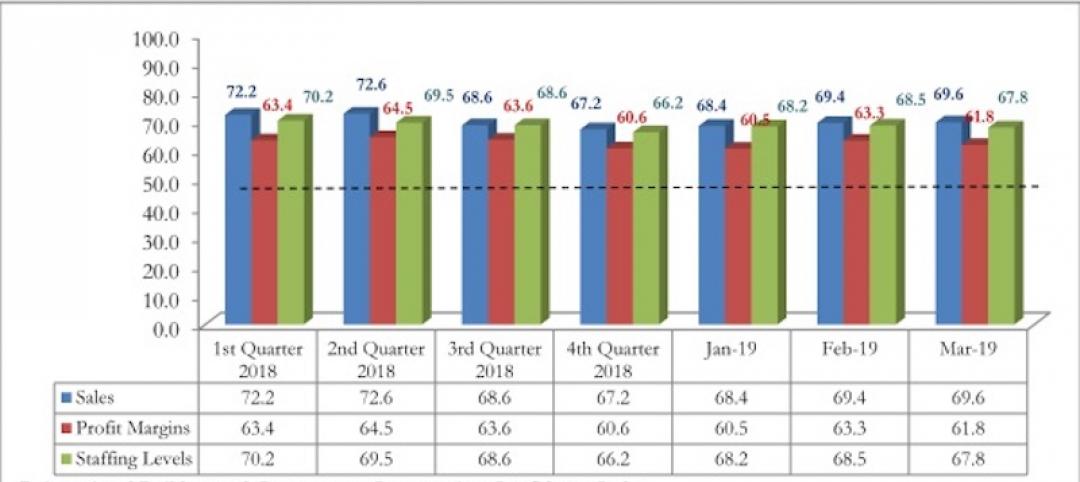
Construction contractors confidence remains high in March
More than 70% of contractors expect to increase staffing levels over the next six months.
Market Data | May 22, 2019
Slight rebound for architecture billings in April
AIA’s ABI score for April showed a small increase in design services at 50.5 in April.

Market Data | May 9, 2019
The U.S. hotel construction pipeline continues to grow in the first quarter as the economy shows surprising strength
Projects currently under construction stand at 1,709 projects/227,924 rooms.
Market Data | May 9, 2019
Construction input prices continue to rise
Nonresidential input prices rose 0.9% compared to March and are up 2.8% on an annual basis.
Market Data | May 7, 2019
Construction costs in major metros continued to climb last year
Latest Rider Levett Bucknall report estimates rise at more than double the rate of 2018 Growth Domestic Product.
Market Data | Apr 29, 2019
U.S. economic growth crosses 3% threshold to begin the year
Growth was fueled by myriad factors, including personal consumption expenditures, private inventory investment, surprisingly rapid growth in exports, state and local government spending and intellectual property.


