


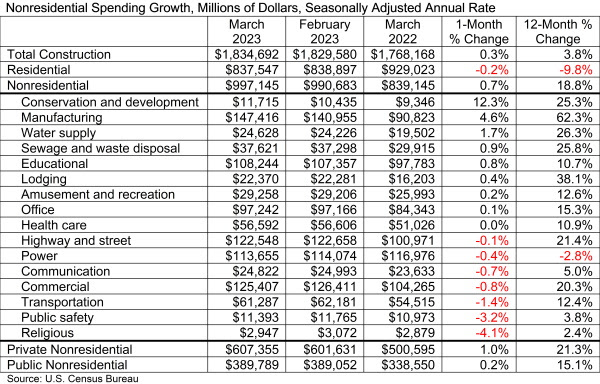
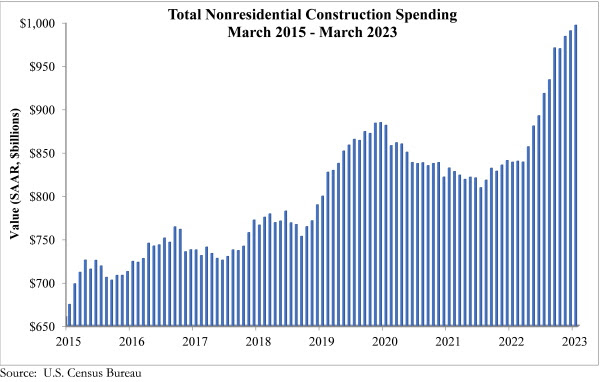
National nonresidential construction spending increased by 0.7% in March, according to an Associated Builders and Contractors analysis of data published today by the U.S. Census Bureau. On a seasonally adjusted annualized basis, nonresidential spending totaled $997.1 billion for the month.
Spending increased on a monthly basis in 8 of the 16 nonresidential subcategories. Private nonresidential spending rose 1.0%, while public nonresidential construction spending increased 0.2% in March.
“Nonresidential construction spending increased for the 10th time in the past 11 months,” said ABC Chief Economist Anirban Basu. “As has been the case for the past several months, though, the expansion in nonresidential investment is attributable to manufacturing. Were it not for a 4.6% increase in manufacturing-related spending, the nonresidential category would have been flat in March. Because this data is not adjusted for inflation, real nonresidential construction spending excluding manufacturing actually contracted in March."
“Contractors remain optimistic about their sales and profit margins over the next six months, according to ABC’s Construction Confidence Index,” said Basu. “Given the surprising resilience of construction activity in the face of ongoing interest rate increases and pervasive fears of recession, this confidence has proved justified. Spending has increased over the past year in every nonresidential subsector except for the power category, and multifamily construction is up 23.0% over the past year. The only construction category that is meaningfully affected by interest rate increases is single-family construction; spending is down 22.9% since March 2022.”
Related Stories

Industry Research | Jun 26, 2017
Time to earn an architecture license continues to drop
This trend is driven by candidates completing the experience and examination programs concurrently and more quickly.

Industry Research | Jun 22, 2017
ABC's Construction Backlog Indicator rebounds in 2017
The first quarter showed gains in all categories.

Market Data | Jun 21, 2017
Design billings maintain solid footing, strong momentum reflected in project inquiries/design contracts
Balanced growth results in billings gains in all sectors.

Market Data | Jun 16, 2017
Residential construction was strong, but not enough, in 2016
The Joint Center for Housing Studies’ latest report expects minorities and millennials to account for the lion’s share of household formations through 2035.

Industry Research | Jun 15, 2017
Commercial Construction Index indicates high revenue and employment expectations for 2017
USG Corporation (USG) and U.S. Chamber of Commerce release survey results gauging confidence among industry leaders.

Market Data | Jun 2, 2017
Nonresidential construction spending falls in 13 of 16 segments in April
Nonresidential construction spending fell 1.7% in April 2017, totaling $696.3 billion on a seasonally adjusted, annualized basis, according to analysis of U.S. Census Bureau data released today by Associated Builders and Contractors.

Industry Research | May 25, 2017
Project labor agreement mandates inflate cost of construction 13%
Ohio schools built under government-mandated project labor agreements (PLAs) cost 13.12 percent more than schools that were bid and constructed through fair and open competition.

Market Data | May 24, 2017
Design billings increasing entering height of construction season
All regions report positive business conditions.

Market Data | May 24, 2017
The top franchise companies in the construction pipeline
3 franchise companies comprise 65% of all rooms in the Total Pipeline.

Industry Research | May 24, 2017
These buildings paid the highest property taxes in 2016
Office buildings dominate the list, but a residential community climbed as high as number two on the list.


