


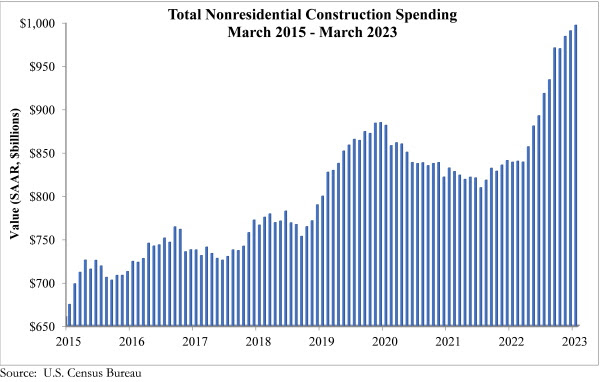
National nonresidential construction spending increased by 0.7% in March, according to an Associated Builders and Contractors analysis of data published today by the U.S. Census Bureau. On a seasonally adjusted annualized basis, nonresidential spending totaled $997.1 billion for the month.
Spending increased on a monthly basis in 8 of the 16 nonresidential subcategories. Private nonresidential spending rose 1.0%, while public nonresidential construction spending increased 0.2% in March.
“Nonresidential construction spending increased for the 10th time in the past 11 months,” said ABC Chief Economist Anirban Basu. “As has been the case for the past several months, though, the expansion in nonresidential investment is attributable to manufacturing. Were it not for a 4.6% increase in manufacturing-related spending, the nonresidential category would have been flat in March. Because this data is not adjusted for inflation, real nonresidential construction spending excluding manufacturing actually contracted in March."
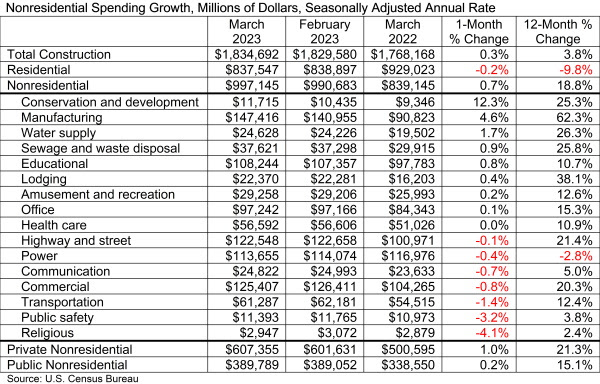
“Contractors remain optimistic about their sales and profit margins over the next six months, according to ABC’s Construction Confidence Index,” said Basu. “Given the surprising resilience of construction activity in the face of ongoing interest rate increases and pervasive fears of recession, this confidence has proved justified. Spending has increased over the past year in every nonresidential subsector except for the power category, and multifamily construction is up 23.0% over the past year. The only construction category that is meaningfully affected by interest rate increases is single-family construction; spending is down 22.9% since March 2022.”
Related Stories

Industry Research | Aug 11, 2017
NCARB releases latest data on architectural education, licensure, and diversity
On average, becoming an architect takes 12.5 years—from the time a student enrolls in school to the moment they receive a license.

Market Data | Aug 4, 2017
U.S. grand total construction starts growth projection revised slightly downward
ConstructConnect’s quarterly report shows courthouses and sports stadiums to end 2017 with a flourish.

Market Data | Aug 2, 2017
Nonresidential Construction Spending falls in June, driven by public sector
June’s weak construction spending report can be largely attributed to the public sector.

Market Data | Jul 31, 2017
U.S. economic growth accelerates in second quarter; Nonresidential fixed investment maintains momentum
Nonresidential fixed investment, a category of GDP embodying nonresidential construction activity, expanded at a 5.2% seasonally adjusted annual rate.

Multifamily Housing | Jul 27, 2017
Apartment market index: Business conditions soften, but still solid
Despite some softness at the high end of the apartment market, demand for apartments will continue to be substantial for years to come, according to the National Multifamily Housing Council.

Market Data | Jul 25, 2017
What's your employer value proposition?
Hiring and retaining talent is one of the top challenges faced by most professional services firms.

Market Data | Jul 25, 2017
Moderating economic growth triggers construction forecast downgrade for 2017 and 2018
Prospects for the construction industry have weakened with developments over the first half of the year.

Industry Research | Jul 6, 2017
The four types of strategic real estate amenities
From swimming pools to pirate ships, amenities (even crazy ones) aren’t just perks, but assets to enhance performance.
Market Data | Jun 29, 2017
Silicon Valley, Long Island among the priciest places for office fitouts
Coming out on top as the most expensive market to build out an office is Silicon Valley, Calif., with an out-of-pocket cost of $199.22.

Market Data | Jun 26, 2017
Construction disputes were slightly less contentious last year
But poorly written and administered contracts are still problems, says latest Arcadis report.


