


The National Council of Architectural Registration Boards (NCARB) recently launched its annual data report, NCARB by the Numbers. The 2017 edition provides exclusive insight into the number of U.S. architects, the value of graduating from an accredited program, the time it takes to earn a license, and diversity in the profession.
Key findings from the latest edition, which is based on data from the 2016 calendar year, include:
- Over 8,100 licensure candidates completed the Architectural Experience Program (AXP) in 2016—an all-time high.
- On average, candidates take 4.2 years to complete the AXP.
- Around 4,300 candidates completed the Architect Registration Examination® (AR®) in 2016.
- Graduates from accredited architecture programs finish the ARE about five months sooner than their peers from non-accredited programs.
- Sixty-seven percent of candidates overlap their experience and exams—the largest percentage to date.
- On average, becoming an architect takes 12.5 years—from the time a student enrolls in school to the moment they receive a license. This marks the eighth year in a row the timeline to licensure has decreased.
- The pool of candidates working toward licensure is more diverse than ever before, and 36 percent of newly licensed architects are women.
- In 2016, there were 109,748 architects in the United States—a minimal drop from the previous year.
“Every year, the profession turns to NCARB by the Numbers for comprehensive and insightful data on the path to licensure,” said NCARB President Gregory L. Erny, FAIA, NCARB. “As our data analytic capabilities expand, we are now able to shine a light on intriguing, and sometimes controversial, topics—including improving diversity among practitioners and shortening the timeline to licensure.”
The findings are pulled from the nonprofit’s database of over 111,000 NCARB-certified architects and licensure candidates, making NCARB by the Numbers the most comprehensive source for licensure statistics.
To read the full report, explore interactive data charts, and download infographics, visit www.ncarb.org/NBTN2017.
Related Stories

Market Data | Jan 18, 2017
Architecture Billings Index ends year on positive note
Architecture firms close 2016 with the strongest performance of the year.
Industry Research | Jan 12, 2017
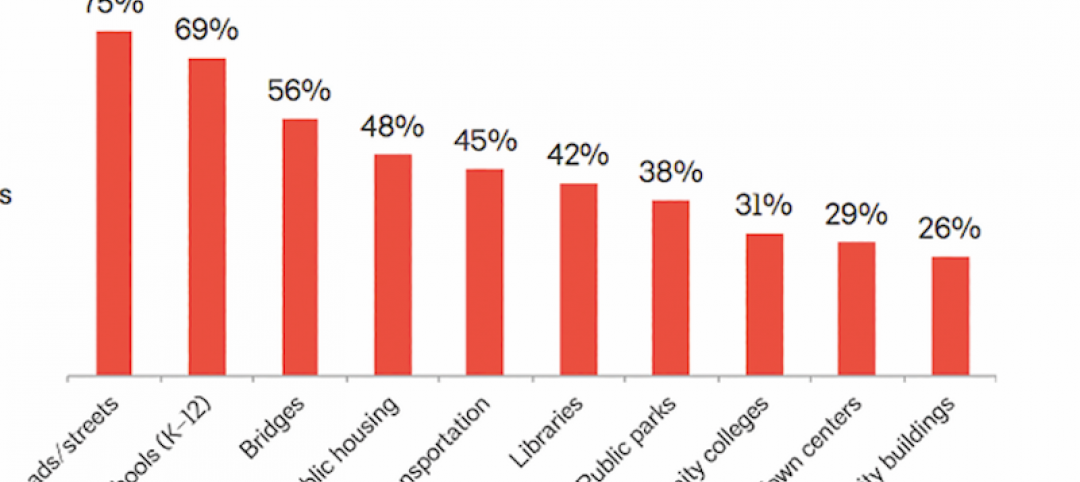
Are public buildings considered infrastructure?
A survey, conducted in October by The Harris Poll on behalf of AIA, asked 2,108 U.S. adults if they considered public buildings part of their community’s infrastructure.

Market Data | Jan 9, 2017
Trump market impact prompts surge in optimism for U.S. engineering firm leaders
The boost in firm leader optimism extends across almost the entire engineering marketplace.
Market Data | Jan 5, 2017
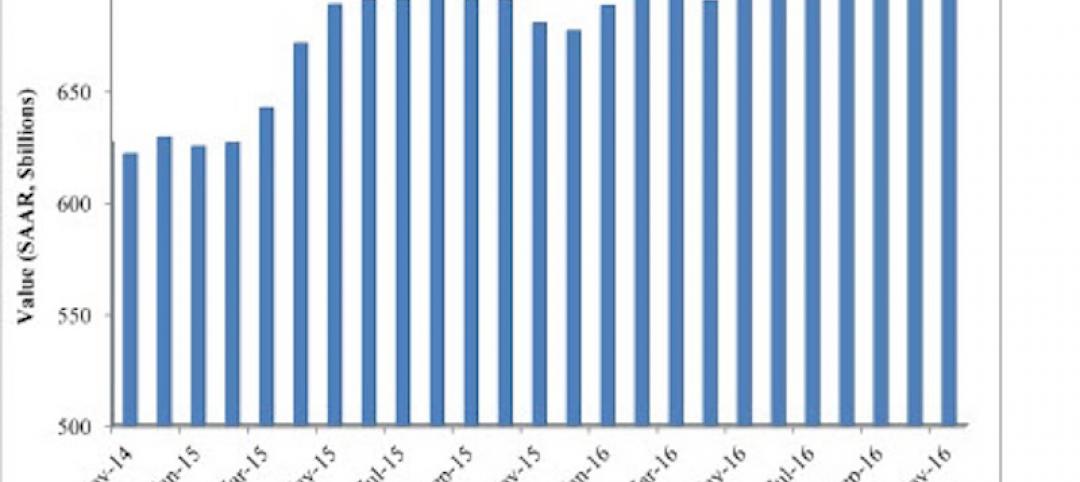
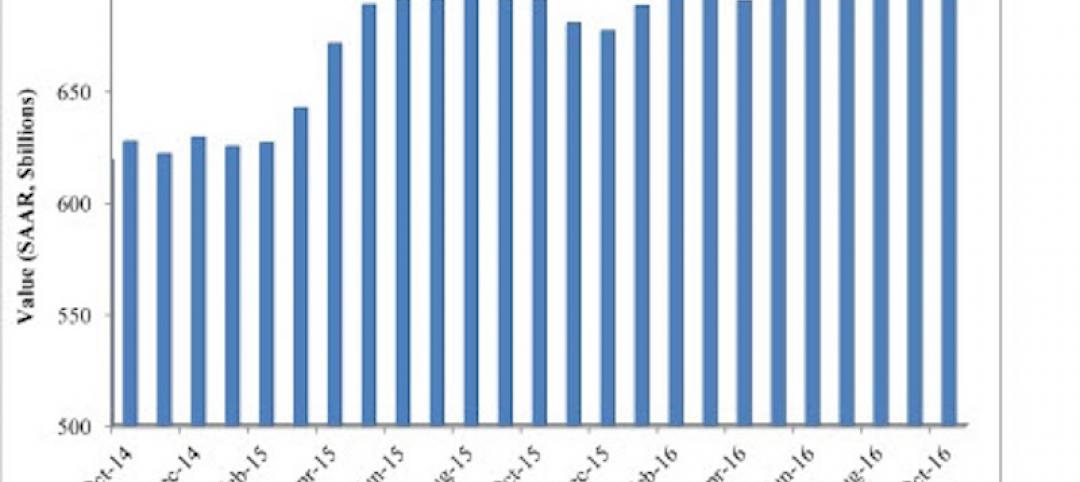
Nonresidential spending thrives in strong November spending report
Many construction firms have reported that they remain busy but have become concerned that work could dry up in certain markets in 2017 or 2018, says Anirban Basu, ABC Chief Economist.
Market Data | Dec 13, 2016
ABC predicts modest growth for 2017 nonresidential construction sector; warns of vulnerability for contractor
“The U.S. economy continues to expand amid a weak global economy and, despite risks to the construction industry, nonresidential spending should expand 3.5 percent in 2017,” says ABC Chief Economist Anirban Basu.
Market Data | Dec 2, 2016
Nonresidential construction spending gains momentum
Nonresidential spending is now 2.6 percent higher than at the same time one year ago.

Market Data | Nov 30, 2016
Marcum Commercial Construction Index reports industry outlook has shifted; more change expected
Overall nonresidential construction spending in September totaled $690.5 billion, down a slight 0.7 percent from a year earlier.

Industry Research | Nov 30, 2016
Multifamily millennials: Here is what millennial renters want in 2017
It’s all about technology and convenience when it comes to the things millennial renters value most in a multifamily facility.
Market Data | Nov 29, 2016
It’s not just traditional infrastructure that requires investment
A national survey finds strong support for essential community buildings.

Industry Research | Nov 28, 2016
Building America: The Merit Shop Scorecard
ABC releases state rankings on policies affecting construction industry.


