

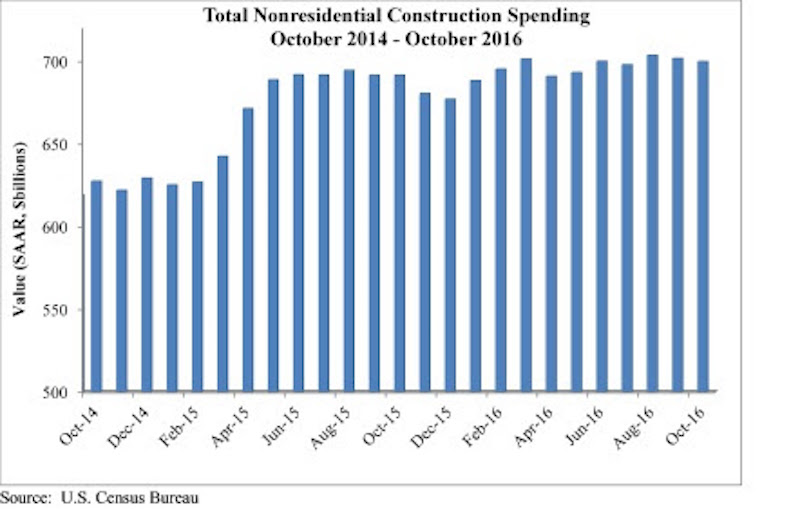
Nonresidential construction spending totaled $699.7 billion on a seasonally adjusted, annualized basis in October, a 0.3 percent decrease from September’s significantly upwardly revised total, but an increase of 2.6 percent year-over-year according to analysis of U.S. Census Bureau data released today by Associated Builders and Contractors (ABC).
September’s nonresidential spending estimate was revised from $690.5 billion to $701.7 billion, a 1.6 percent increase. August’s estimate received a similar revision, increasing from $696.6 billion to $703.6 billion. Nonresidential spending is now 2.6 percent higher than at the same time one year ago.
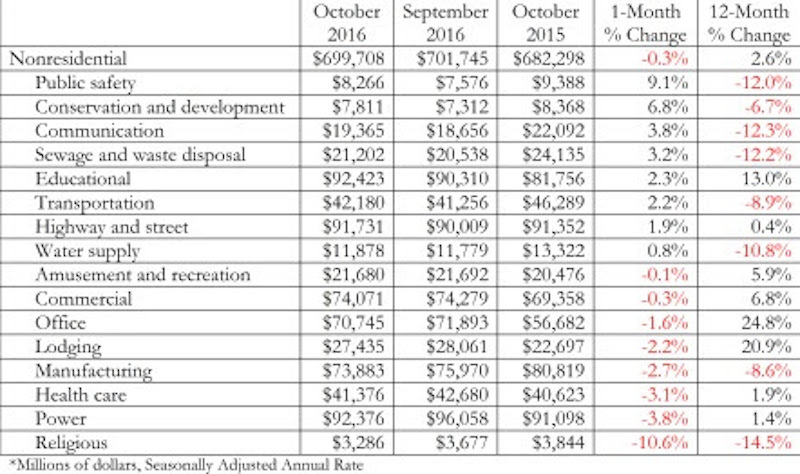
“Nonresidential construction spending is up by nearly 3 percent on a year-over-year basis. Certain segments are red hot, including the office and lodging segments, both of which have experienced more than 20 percent spending growth over the past 12 months,” says ABC Chief Economist Anirban Basu in a press release. “Both major presidential candidates had discussed investing in infrastructure during their campaign. However, there was a conventional wisdom suggesting that divided government would be the most likely outcome, which would likely have translated into more stalemates and less infrastructure spending. With one party now controlling the U.S. Senate, U.S. House of Representatives and the White House, a meaningful infrastructure package may be more likely.”
You can find a chart and a graph illustrating the most recent nonresidential construction spending below.

Related Stories

Hotel Facilities | Apr 24, 2024
The U.S. hotel construction market sees record highs in the first quarter of 2024
As seen in the Q1 2024 U.S. Hotel Construction Pipeline Trend Report from Lodging Econometrics (LE), at the end of the first quarter, there are 6,065 projects with 702,990 rooms in the pipeline. This new all-time high represents a 9% year-over-year (YOY) increase in projects and a 7% YOY increase in rooms compared to last year.

Construction Costs | Apr 18, 2024
New download: BD+C's April 2024 Market Intelligence Report
Building Design+Construction's monthly Market Intelligence Report offers a snapshot of the health of the U.S. building construction industry, including the commercial, multifamily, institutional, and industrial building sectors. This report tracks the latest metrics related to construction spending, demand for design services, contractor backlogs, and material price trends.

Market Data | Apr 16, 2024
The average U.S. contractor has 8.2 months worth of construction work in the pipeline, as of March 2024
Associated Builders and Contractors reported today that its Construction Backlog Indicator increased to 8.2 months in March from 8.1 months in February, according to an ABC member survey conducted March 20 to April 3. The reading is down 0.5 months from March 2023.

K-12 Schools | Apr 10, 2024
Surprise, surprise: Students excel in modernized K-12 school buildings
Too many of the nation’s school districts are having to make it work with less-than-ideal educational facilities. But at what cost to student performance and staff satisfaction?

Multifamily Housing | Apr 9, 2024
March reports record gains in multifamily rent growth in 20 months
Asking rents for multifamily units increased $8 during the month to $1,721; year-over-year growth grew 30 basis points to 0.9 percent—a normal seasonal growth pattern according to Yardi Matrix.

Retail Centers | Apr 4, 2024
Retail design trends: Consumers are looking for wellness in where they shop
Consumers are making lifestyle choices with wellness in mind, which ignites in them a feeling of purpose and a sense of motivation. That’s the conclusion that the architecture and design firm MG2 draws from a survey of 1,182 U.S. adult consumers the firm conducted last December about retail design and what consumers want in healthier shopping experiences.

Market Data | Apr 1, 2024
Nonresidential construction spending dips 1.0% in February, reaches $1.179 trillion
National nonresidential construction spending declined 1.0% in February, according to an Associated Builders and Contractors analysis of data published today by the U.S. Census Bureau. On a seasonally adjusted annualized basis, nonresidential spending totaled $1.179 trillion.

Market Data | Mar 26, 2024
Architecture firm billings see modest easing in February
Architecture firm billings continued to decline in February, with an AIA/Deltek Architecture Billings Index (ABI) score of 49.5 for the month. However, February’s score marks the most modest easing in billings since July 2023 and suggests that the recent slowdown may be receding.

K-12 Schools | Mar 18, 2024
New study shows connections between K-12 school modernizations, improved test scores, graduation rates
Conducted by Drexel University in conjunction with Perkins Eastman, the research study reveals K-12 school modernizations significantly impact key educational indicators, including test scores, graduation rates, and enrollment over time.

MFPRO+ News | Mar 16, 2024
Multifamily rents stable heading into spring 2024
National asking multifamily rents posted their first increase in over seven months in February. The average U.S. asking rent rose $1 to $1,713 in February 2024, up 0.6% year-over-year.


