

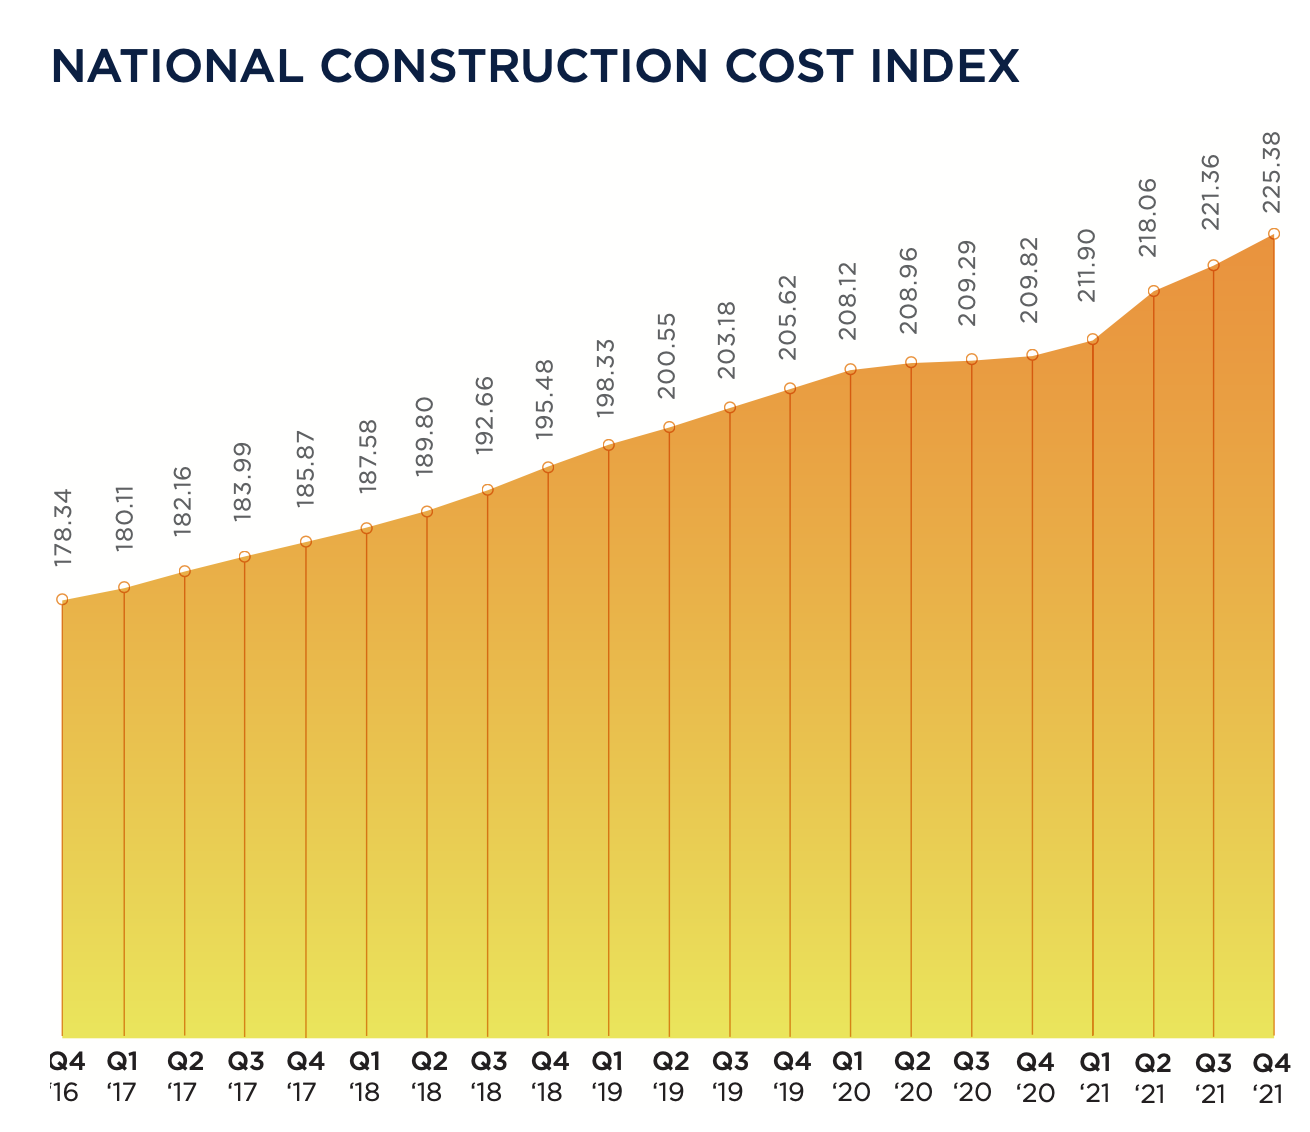
In the 12 months ended December 2021, bid construction costs rose 7.42 percent. “These increases are reminiscent of the sort of cost increases that we saw in the period 2004 to 2007,” wrote Julian Anderson, FRICS, President-North America for the construction advisory firm Rider Levett Bucknall (RLB), which today released its Fourth Quarter 2021 North America Construction Cost Report.
RLB’s National Construction Cost Index for the fourth quarter stood at 225.38, 7.4 percent higher than the Index for the fourth quarter of 2020, and 1.8 percent higher than last year’s third quarter. In his essay for this report, Anderson was optimistic about the eventual positive impact of the recently passed Bipartisan Infrastructure bill on construction and repair.
However, the force of that legislation could be stymied, or at least delayed, by supply chain problems that continue to plague the industry. Bottlenecks at western ports and chronic shortages of skilled labor still contribute to this volatility. Cost increases are also a function of rising inflation, as the Consumer Price Index registered a year-over-year increase of 5.38 percent.
On the positive side, America’s Gross Domestic Product, which measures output, returned to 2.1 percent, which was about where it was in the pre-pandemic fourth quarter of 2019. And the rate of unemployment for the construction sector dipped to 4.5 percent in Q421, versus 9.6 percent in Q420. Construction tracked national unemployment that has also been on a downward trend.
SEVERAL METROS BUCKED QUARTERLY COST TREND
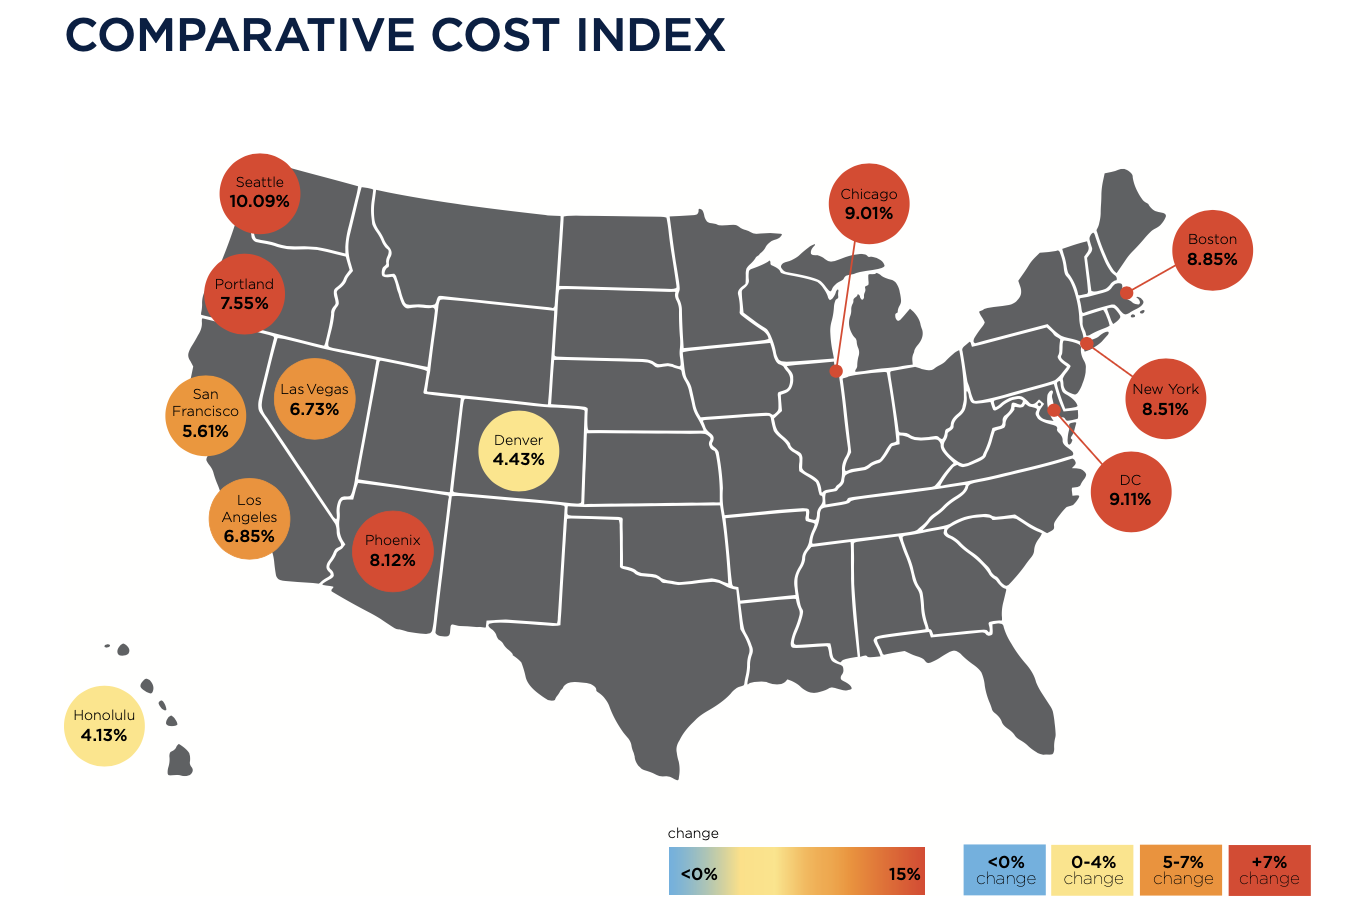
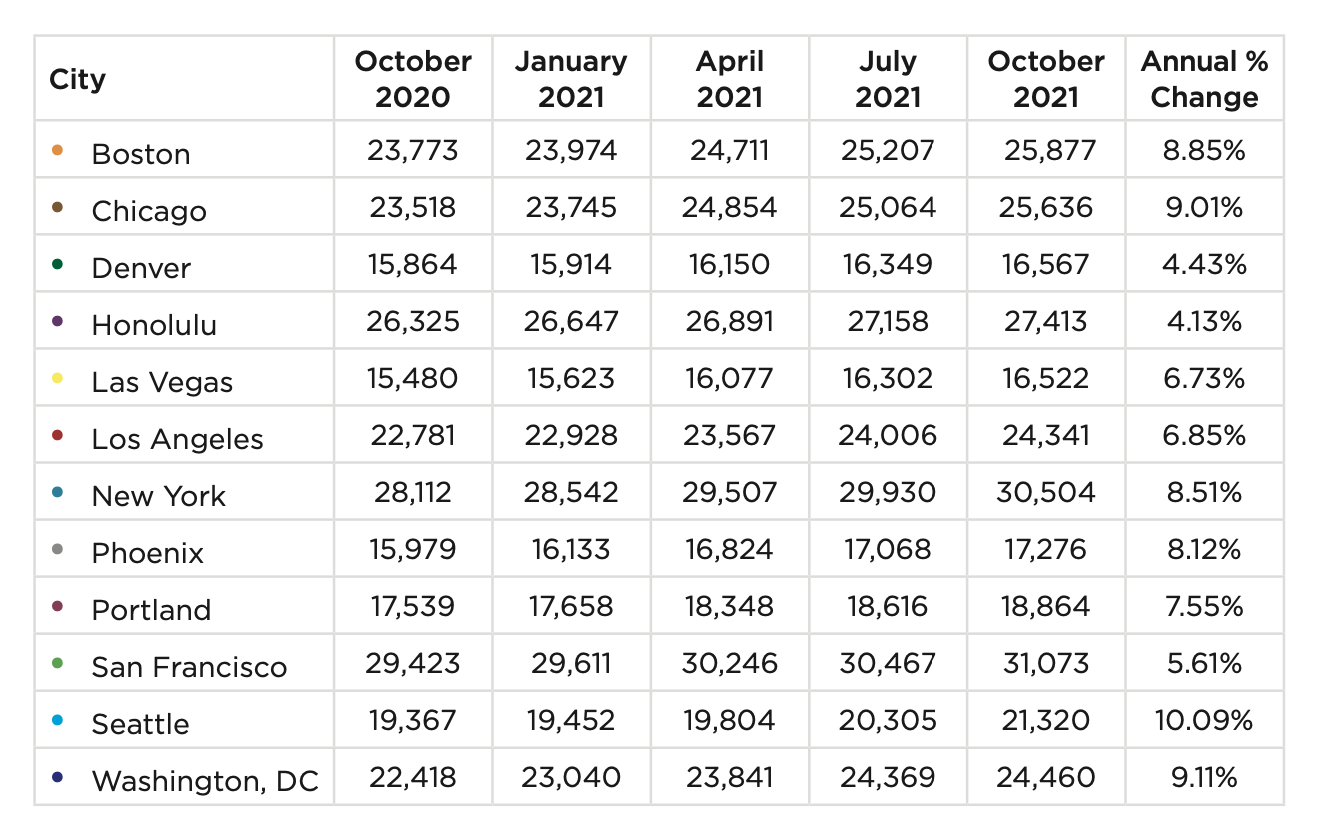
Nonresidential construction spending in November 2021, the latest month for which data were available from the Census Bureau, stood at $820.6 billion, 3.4 percent higher than the same month in 2021. But materials and labor keep getting more expensive, too. RLB’s Comparative Cost Index found that, from October 2020 through October 2021, construction costs rose by 10.09 percent in Seattle, by 9.11 percent in Washington DC, by 9.01 percent in Chicago, by 8.85 percent in Boston, and by 8.51 percent in New York.
Indexed by building type, construction costs were among the highest in New York for offices, shopping malls, hospitals, single-family homes, and high schools. San Francisco’s construction costs exceeded the other markets RLB tracked for five-star hotels, hospitals, warehouses, parking structures, multifamily homes, high schools, and universities.
Honolulu is the most expensive market in which to build elementary schools. But that market, along with Denver, Las Vegas, Los Angeles, Phoenix, Portland, and Washington DC, experienced overall cost increases between July 1 and October 1 that were less than the national average for that period, according to RLB estimates.
Related Stories

Market Data | Apr 4, 2016
ABC: Nonresidential spending slip in February no cause for alarm
Spending in the nonresidential sector totaled $690.3 billion on a seasonally adjusted, annualized basis in February. The figure is a step back but still significantly higher than one year ago.

Market Data | Mar 30, 2016
10 trends for commercial real estate: JLL report
The report looks at global threats and opportunities, and how CRE firms are managing their expectations for growth.

Market Data | Mar 23, 2016
AIA: Modest expansion for Architecture Billings Index
Business conditions softening most in Midwest in recent months.

Retail Centers | Mar 16, 2016
Food and technology will help tomorrow’s malls survive, says CallisonRTKL
CallisonRTKL foresees future retail centers as hubs with live/work/play components.

Market Data | Mar 6, 2016
Real estate execs measure success by how well they manage ‘talent,’ costs, and growth
A new CBRE survey finds more companies leaning toward “smarter” workspaces.

Market Data | Mar 1, 2016
ABC: Nonresidential spending regains momentum in January
Nonresidential construction spending expanded 2.5% on a monthly basis and 12.3% on a yearly basis, totaling $701.9 billion. Spending increased in January in 10 of 16 nonresidential construction sectors.

Market Data | Mar 1, 2016
Leopardo releases 2016 Construction Economics Report
This year’s report shows that spending in 2015 reached the highest level since the Great Recession. Total spending on U.S. construction grew 10.5% to $1.1 trillion, the largest year-over-year gain since 2007.

Market Data | Feb 26, 2016
JLL upbeat about construction through 2016
Its latest report cautions about ongoing cost increases related to finding skilled laborers.

Market Data | Feb 17, 2016
AIA reports slight contraction in Architecture Billings Index
Multifamily residential sector improving after sluggish 2015.

Market Data | Feb 11, 2016
AIA: Continued growth expected in nonresidential construction
The American Institute of Architects’ semi-annual Consensus Construction Forecast indicates a growth of 8% in construction spending in 2016, and 6.7% the following year.


