

In the 12 months ended December 2021, bid construction costs rose 7.42 percent. “These increases are reminiscent of the sort of cost increases that we saw in the period 2004 to 2007,” wrote Julian Anderson, FRICS, President-North America for the construction advisory firm Rider Levett Bucknall (RLB), which today released its Fourth Quarter 2021 North America Construction Cost Report.
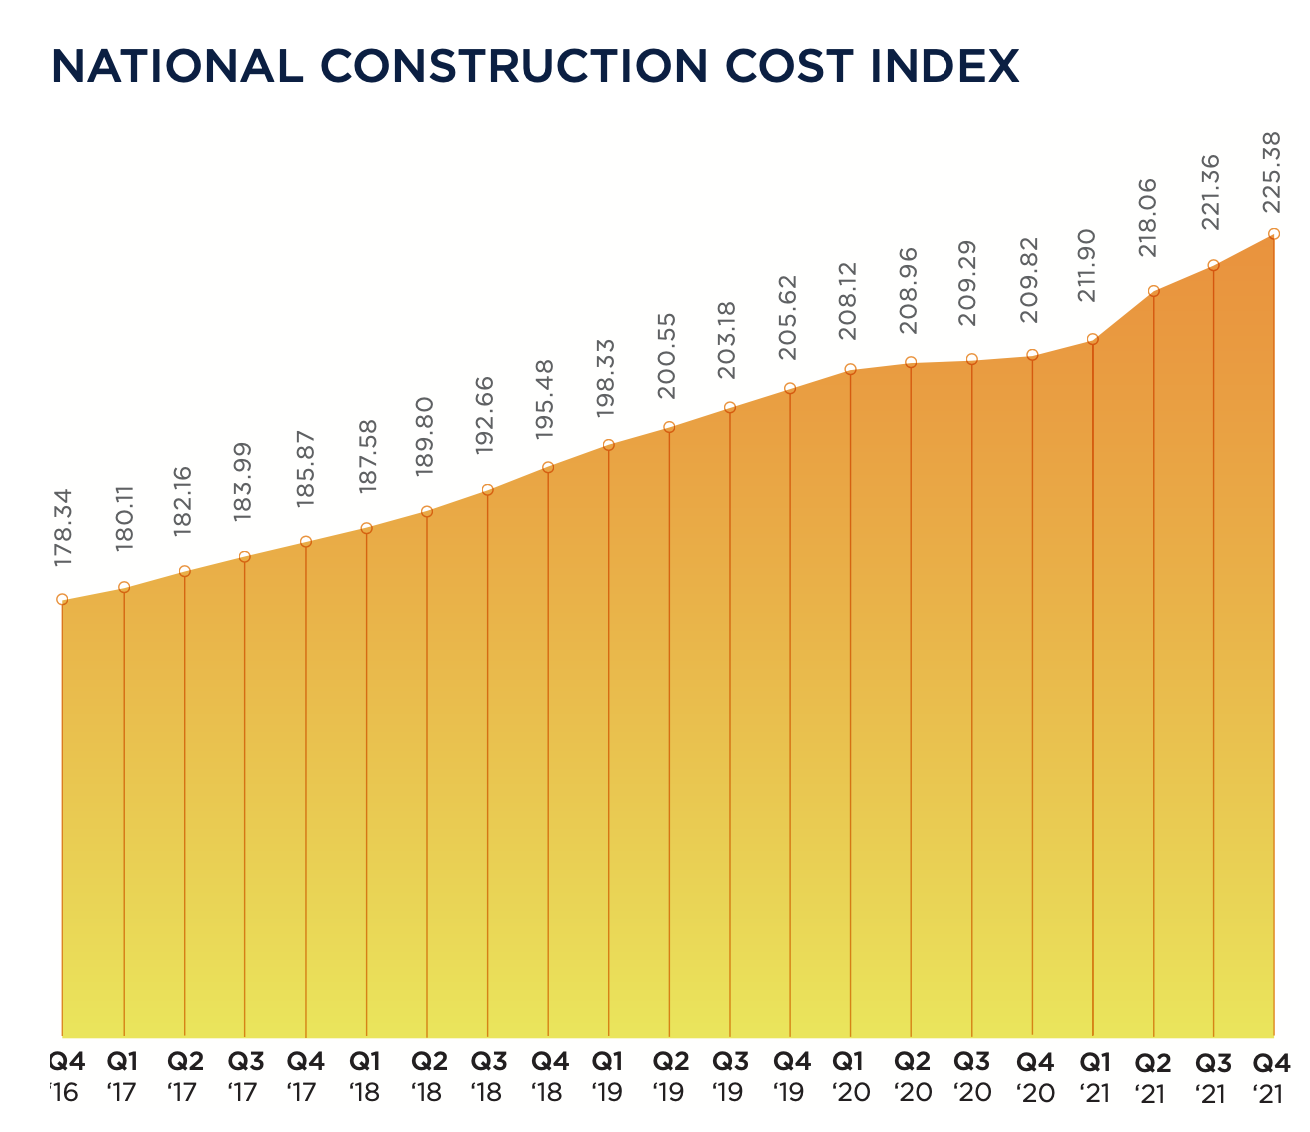
RLB’s National Construction Cost Index for the fourth quarter stood at 225.38, 7.4 percent higher than the Index for the fourth quarter of 2020, and 1.8 percent higher than last year’s third quarter. In his essay for this report, Anderson was optimistic about the eventual positive impact of the recently passed Bipartisan Infrastructure bill on construction and repair.
However, the force of that legislation could be stymied, or at least delayed, by supply chain problems that continue to plague the industry. Bottlenecks at western ports and chronic shortages of skilled labor still contribute to this volatility. Cost increases are also a function of rising inflation, as the Consumer Price Index registered a year-over-year increase of 5.38 percent.
On the positive side, America’s Gross Domestic Product, which measures output, returned to 2.1 percent, which was about where it was in the pre-pandemic fourth quarter of 2019. And the rate of unemployment for the construction sector dipped to 4.5 percent in Q421, versus 9.6 percent in Q420. Construction tracked national unemployment that has also been on a downward trend.
SEVERAL METROS BUCKED QUARTERLY COST TREND
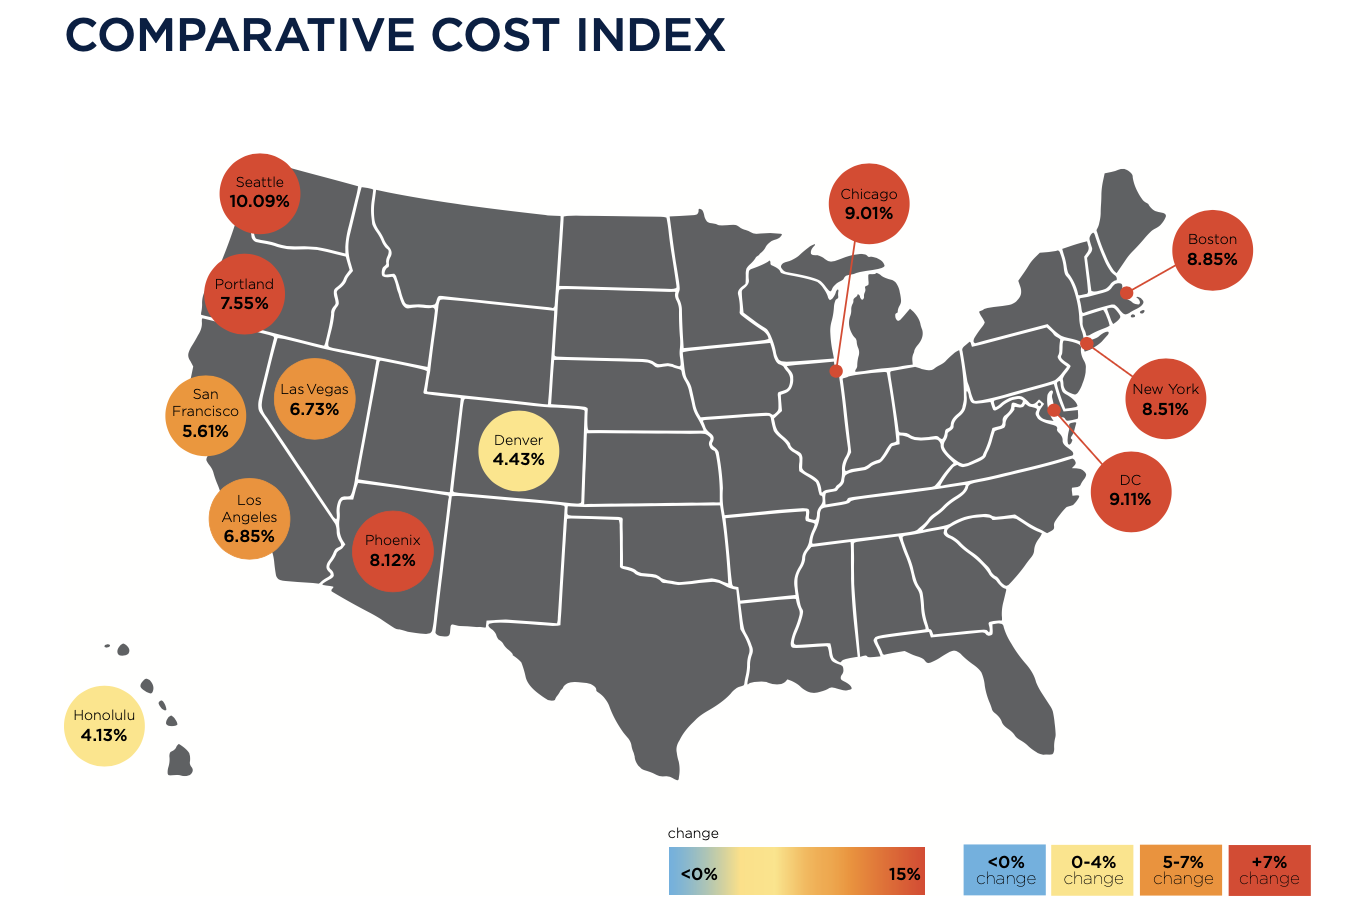
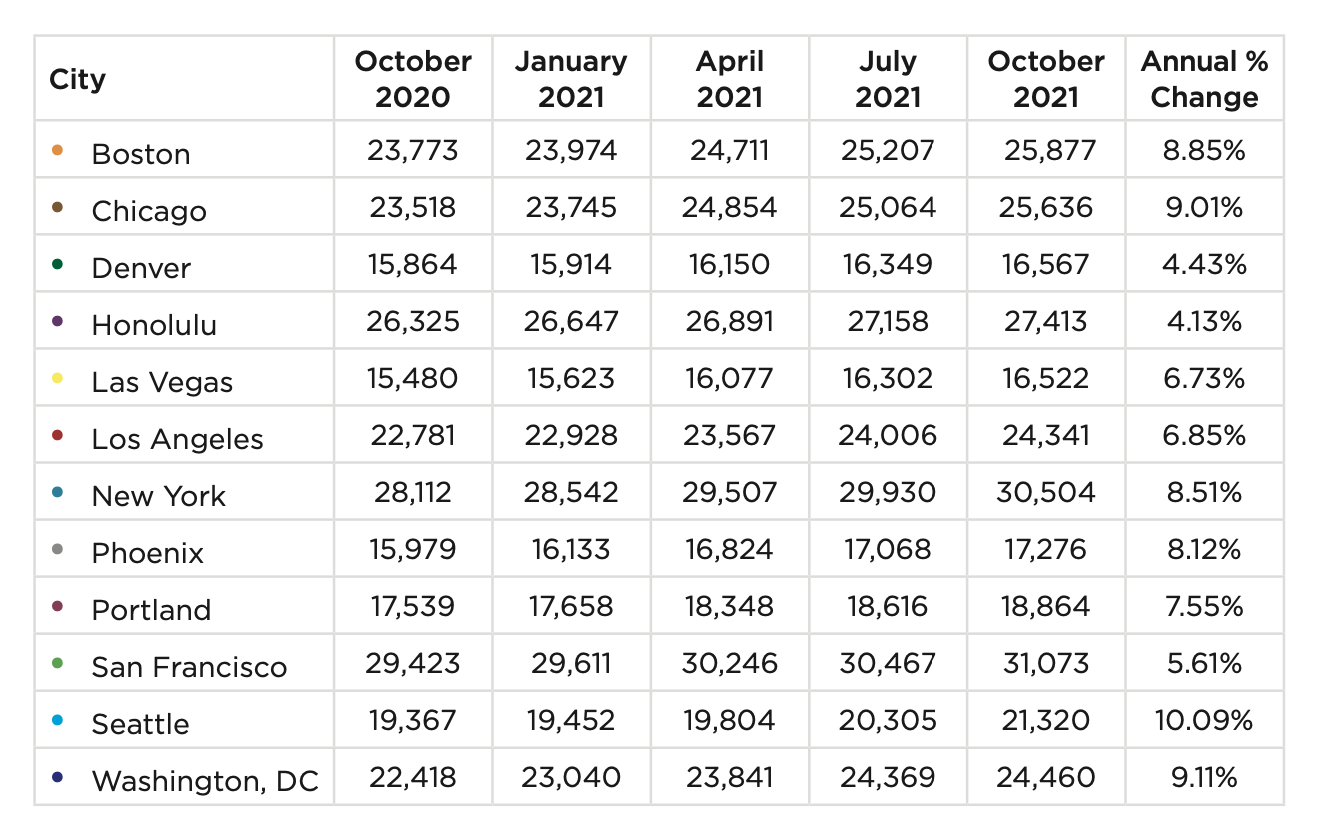
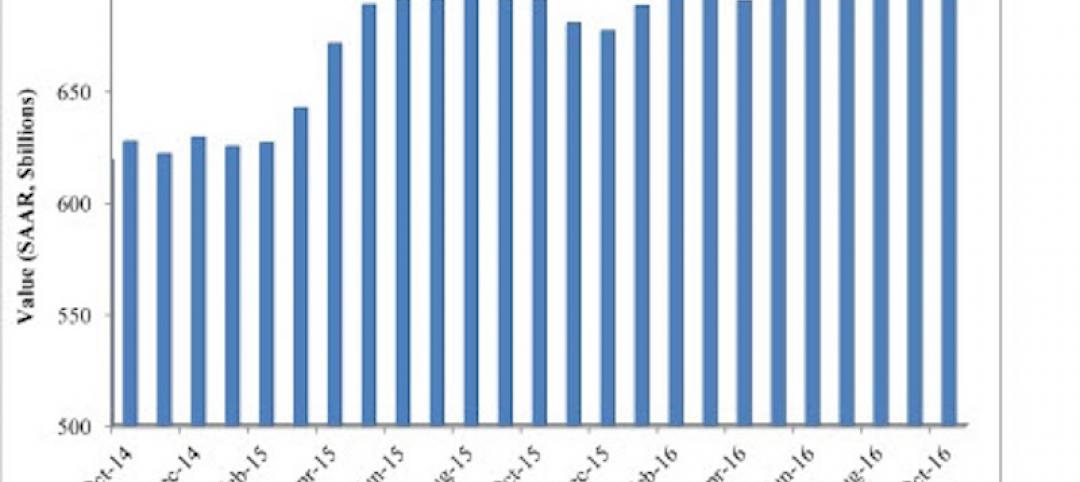
Nonresidential construction spending in November 2021, the latest month for which data were available from the Census Bureau, stood at $820.6 billion, 3.4 percent higher than the same month in 2021. But materials and labor keep getting more expensive, too. RLB’s Comparative Cost Index found that, from October 2020 through October 2021, construction costs rose by 10.09 percent in Seattle, by 9.11 percent in Washington DC, by 9.01 percent in Chicago, by 8.85 percent in Boston, and by 8.51 percent in New York.
Indexed by building type, construction costs were among the highest in New York for offices, shopping malls, hospitals, single-family homes, and high schools. San Francisco’s construction costs exceeded the other markets RLB tracked for five-star hotels, hospitals, warehouses, parking structures, multifamily homes, high schools, and universities.
Honolulu is the most expensive market in which to build elementary schools. But that market, along with Denver, Las Vegas, Los Angeles, Phoenix, Portland, and Washington DC, experienced overall cost increases between July 1 and October 1 that were less than the national average for that period, according to RLB estimates.
Related Stories
High-rise Construction | Jan 23, 2017
Growth spurt: A record-breaking 128 buildings of 200 meters or taller were completed in 2016
This marks the third consecutive record-breaking year for building completions over 200 meters.

Market Data | Jan 18, 2017
Fraud and risk incidents on the rise for construction, engineering, and infrastructure businesses
Seven of the 10 executives in the sector surveyed in the report said their company fell victim to fraud in the past year.

Market Data | Jan 18, 2017
Architecture Billings Index ends year on positive note
Architecture firms close 2016 with the strongest performance of the year.
Market Data | Jan 12, 2017
73% of construction firms plan to expand their payrolls in 2017
However, many firms remain worried about the availability of qualified workers.

Market Data | Jan 9, 2017
Trump market impact prompts surge in optimism for U.S. engineering firm leaders
The boost in firm leader optimism extends across almost the entire engineering marketplace.
Market Data | Jan 5, 2017
Nonresidential spending thrives in strong November spending report
Many construction firms have reported that they remain busy but have become concerned that work could dry up in certain markets in 2017 or 2018, says Anirban Basu, ABC Chief Economist.
Market Data | Dec 21, 2016
Architecture Billings Index up slightly in November
New design contracts also return to positive levels, signifying future growth in construction activity.
Market Data | Dec 21, 2016
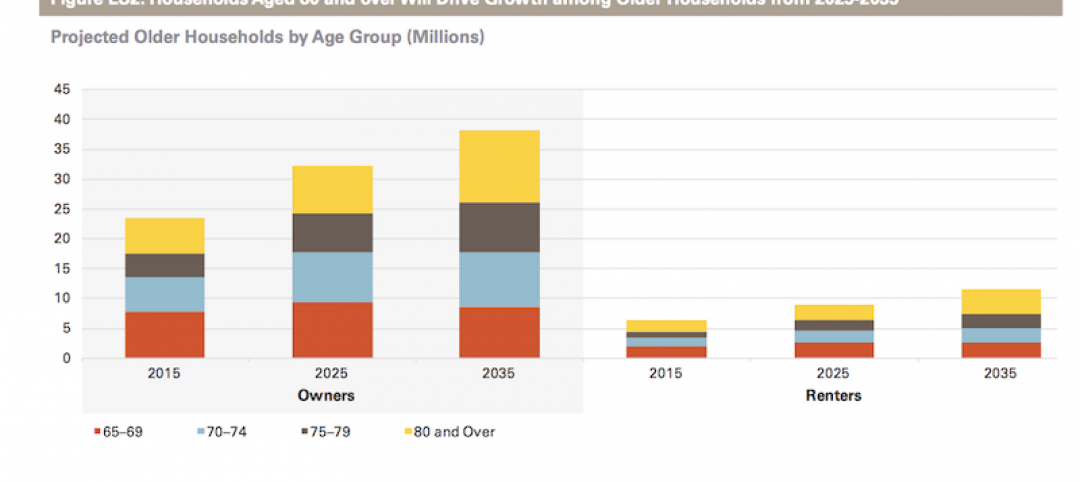
Will housing adjust to an aging population?
New Joint Center report projects 66% increase in senior heads of households by 2035.
Market Data | Dec 13, 2016
ABC predicts modest growth for 2017 nonresidential construction sector; warns of vulnerability for contractor
“The U.S. economy continues to expand amid a weak global economy and, despite risks to the construction industry, nonresidential spending should expand 3.5 percent in 2017,” says ABC Chief Economist Anirban Basu.
Market Data | Dec 2, 2016
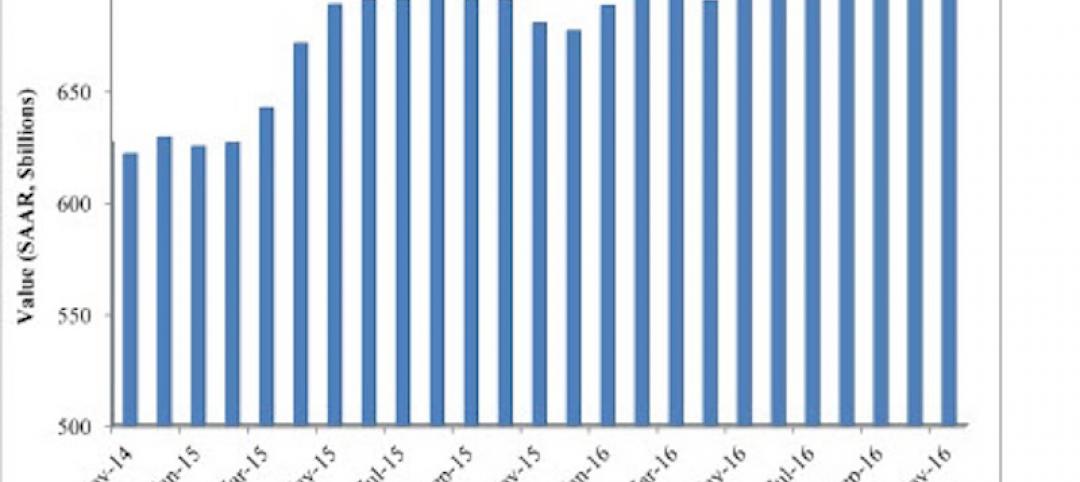
Nonresidential construction spending gains momentum
Nonresidential spending is now 2.6 percent higher than at the same time one year ago.


