


The Architecture Billings Index (ABI) recorded its sixth consecutive positive month, according to a new report today from The American Institute of Architects (AIA).
The ABI score for July was 54.6. While this was down slightly from June’s score of 57.1, it still indicates very strong business conditions overall (any score above 50 indicates an increase in billings from the prior month). Scoring for new project inquiries also declined in July but remained near its all-time high at 65.0. The score for new design contracts was essentially unchanged from June to July with a score of 58.0.
“In prior business cycles, architecture firms generally saw their project work soften quickly and then recover slowly,” said AIA Chief Economist, Kermit Baker, Hon. AIA, PhD. “So the strength of this recovery is unprecedented. Firm leaders who have leaned into this economic upturn by reinvesting in their firms by hiring staff and upgrading their technology, will likely have a better year than those that anticipated a slower recovery.”
Key ABI highlights for July include:
- Regional averages: Midwest (58.3); West (56.0); South (54.6); Northeast (54.1)
- Sector index breakdown: commercial/industrial (58.4); institutional (55.4); multi-family residential (54.7); mixed practice (54.4)
The regional and sector categories are calculated as a three-month moving average, whereas the national index, design contracts and inquiries are monthly numbers.
To learn more about recent economic developments impacting design and construction, visit AIA’s website.
Related Stories
Hotel Facilities | Sep 6, 2017
Marriott has the largest construction pipeline of any franchise company in the U.S.
Marriott has the most rooms currently under construction with 482 Projects/67,434 Rooms.
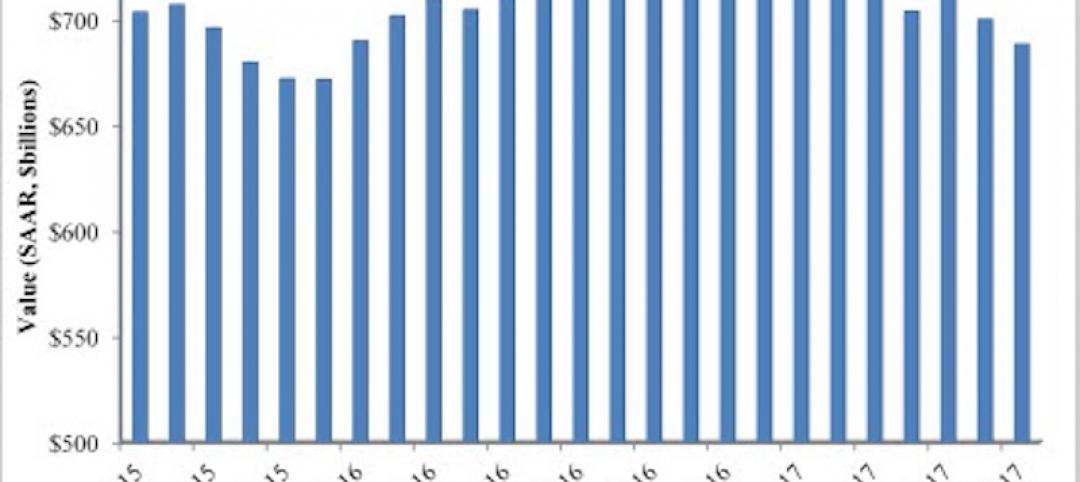
Market Data | Sep 5, 2017
Nonresidential construction declines again, public and private sector down in July
Weakness in spending was widespread.

Market Data | Aug 29, 2017
Hidden opportunities emerge from construction industry challenges
JLL’s latest construction report shows stability ahead with tech and innovation leading the way.

Market Data | Aug 28, 2017
U.S. hotel construction pipeline is up 7% year-over-year
For the economy, the rate of growth may be low but it’s running on all cylinders.
Market Data | Aug 23, 2017
Architecture Billings Index growth moderates
“The July figures show the continuation of healthy trends in the construction sector of our economy,” said AIA Chief Economist, Kermit Baker.

Architects | Aug 21, 2017
AIA: Architectural salaries exceed gains in the broader economy
AIA’s latest compensation report finds average compensation for staff positions up 2.8% from early 2015.
Market Data | Aug 20, 2017
Some suburban office markets are holding their own against corporate exodus to cities
An analysis of mortgage-backed loans suggests that demand remains relatively steady.
Market Data | Aug 17, 2017
Marcum Commercial Construction Index reports second quarter spending increase in commercial and office construction
Spending in all 12 of the remaining nonresidential construction subsectors retreated on both an annualized and monthly basis.

Industry Research | Aug 11, 2017
NCARB releases latest data on architectural education, licensure, and diversity
On average, becoming an architect takes 12.5 years—from the time a student enrolls in school to the moment they receive a license.

Market Data | Aug 4, 2017
U.S. grand total construction starts growth projection revised slightly downward
ConstructConnect’s quarterly report shows courthouses and sports stadiums to end 2017 with a flourish.


