Some suburban office markets are holding their own against corporate exodus to cities

In its latest report on the U.S. office market, JLL notes that a second-quarter rebound this year delivered 11.7 million sf of new office space. Much of what’s being built in the office sector is occurring in the central business districts of cities around the country, as companies gravitate closer to where they believe they’ll have their best shots at attracting Millennial workers.
But to paraphrase Mark Twain, news of the death of suburban office space may be greatly exaggerated. Corporate America hasn’t quite abandoned the suburbs to the extent that some experts were predicting not to long ago.
In its Second-Quarter 2017 Office Market Report, Transwestern singles out New Jersey, where “renewed interest” in suburban office properties helped push the Garden State’s overall average office rents to $26.42 per sf, nearly $2 per sf higher than five years ago and the market’s highest mid-year level since 2001.
CBRE this summer looked at the 25 largest suburban markets it covers, and found “they have performed better than is commonly perceived.” CBRE went on to state that suburban office submarkets with urban characteristics—higher densities of office space, housing, and retail, as well as transportation access—are in the best position to capture occupier demand.
CBRE also found that rents in more than half of the most established suburban submarkets exceed their downtown counterparts.
Despite the flight from suburbs to cities over the past few years by such high-profile companies as General Electric, McDonald’s, Aetna, and ConAgra, suburban and urban office properties that collateralize commercial mortgage-backed securities (CMBS) loans have comparable occupancy rates (89.1% vs. 89.6%), according to a new analysis by Trepp, a leading data provider to the CMBS and banking industries.
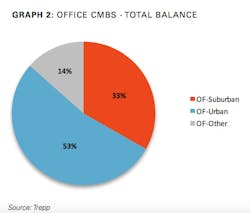
Suburban office loans account for one-third of outstanding CMBS debt. However, they are often more distressed than urban office loans, and have higher rates of delinquency. Image: Trepp
Trepp estimates that suburban office loans account for one-third of the $125.1 billion in outstanding CMBS debt. And new issuance for suburban offices reached $3.2 billion in the first half of 2017, up 43% compared to the same period a year ago. Trepp infers that from these data that “demand is still relatively steady” for suburban office space.
There are caveats, though, not the least of which being that suburban offices carry the highest percentage of distressed debt in the sector: 14.5%, compared to 4.9% for urban office loans. Suburban office loans also carry a noticeably high delinquency rate: 13.3%, which is down from 15.9% in April, but still nearly five percentage points higher than the broader office sector’s delinquencies.
In its analysis, Trepp quotes from Hartford Business, a journal in Connecticut, which observes that the nationwide migration toward urban office space is often a management trend, where companies are reallocating resources and their top talent to office space in cities, but still keep the bulk of their employees in suburban offices.