


A new report on office fit-out costs in North America sets out to establish a range of benchmarks for three different office styles, and to suggest what businesses favor which style.
JLL’s project and development services group, which produced the report, used data from more than 2,800 JLL-managed project budgets for over 100 clients from 17 industries in 59 markets throughout the U.S. and Canada.
The goal, says JLL, is to “elevate the conversation” around the real costs of building out various real estate designs. This year’s report includes office layout and space quality components to allow for evaluations of different office layouts, project complexities, and materials. It also provides high, medium, and low allowances for furniture, fixtures, and equipment (FFE); as well as for the installation of audio-visual and security equipment.
The result is an Office Fit Out Matrix, which shows how a handful of dynamics affect fit-out costs. Depending on the market and style, the costs range from $120.18 per sf to $216.07 per sf (see chart).
JLL breaks down these costs by region and metro market. The Northeast and Northwest consistently have higher fit-out costs. The medium costs in New York City are 28.5% above the U.S. average. In San Francisco, a fit-out would cost 22.6% more than the U.S. average. Conversely, the medium fit-out costs in West Palm Beach, Fla., are 15.9% below the national average; in Austin, Texas, 15.3% below.
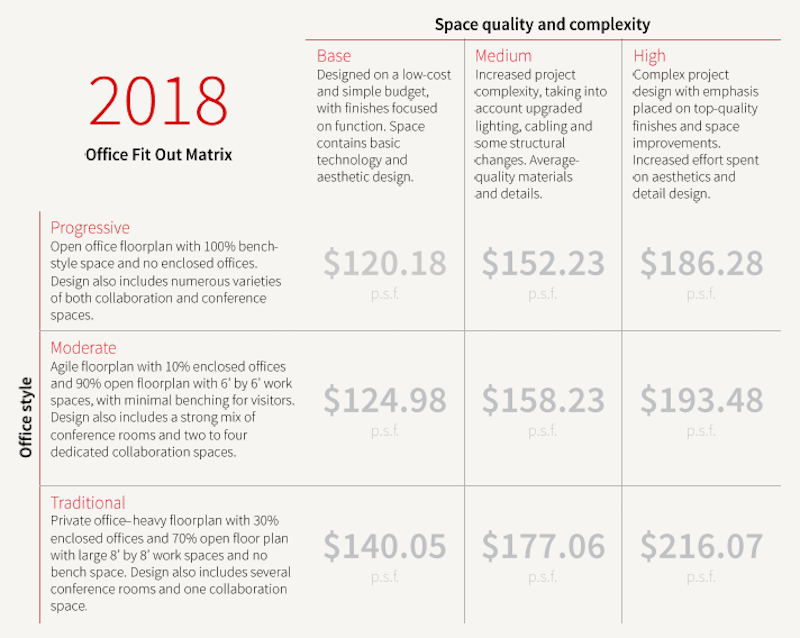
This office fit-out matrix is based on data from over 2,800 project budgets in North America that JLL managed. Image: JLL
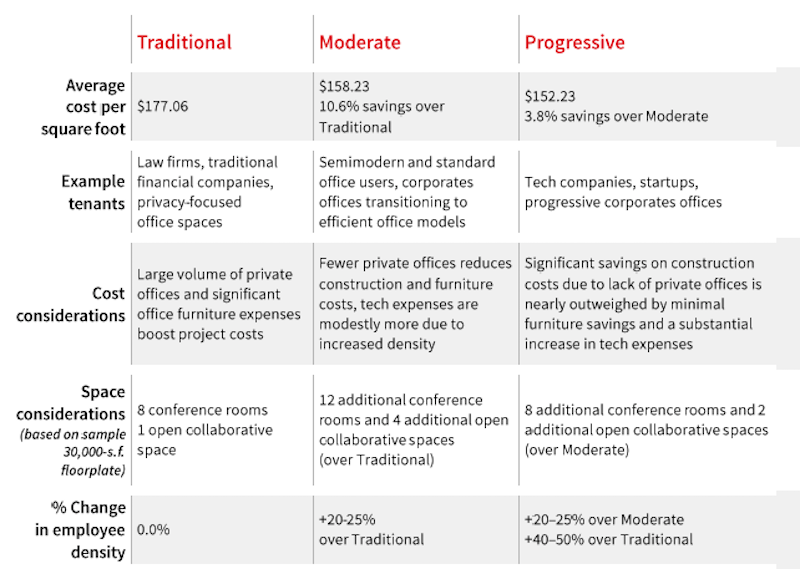
JLL's matrix compares the medium costs for fitting out three different office styles. Image: JLL
Three office styles examined
JLL divides its office fit-out costs along three styles:
• A Traditional office is still the most expensive to fit out. This style has the highest percentage of private office spaces, and typically between 20% and 50% fewer employees than the other two styles. Its FFE costs are the highest among the three styles, too. And tenant factors are “relatively small,” says JLL, because there is less common area. These offices are still favored by law firms, financial services companies, and businesses that focus on privacy with their offices.
JLL observes that some Traditional office styles are introducing lower-partition bench desks.
• A less-expensive fit-out, a Moderate office style features “agile” floorplans, with 10% dedicated to enclosed offices, and the rest of the space open with 6x6-foot workstations and minimal benching and guest space. Moderate offices—which are 20-25% less dense than Progressive office styles—include a healthy mix of conference rooms, and a few multipurpose and collaborative spaces. The hard fit-out costs for the Moderate style are average, but cost efficiencies can be captured by adding more bench-style desks.
• The Progressive office style is distinguished by an open floorplan, 100% of its desk space outfitted as bench-style furniture with zero enclosed spaces. This style’s focus is on activity-based working. Its employee density is 20-50% higher than a Traditional office, and it has double the amount of collaborative and conference spaces. (A standard plan would include 20 conference rooms and seven open collaborative/multi-use spaces.)
JLL points out that Progressive fit-outs generally have higher technology costs, but save money on FFE spending.
Landlords allowing for more upgrades
Last year, nearly 69 million sf of new office space were delivered to the market, but only 47.4% was preleased. JLL’s report observes that landlords are spending more to compete for tenants that are consistently gravitating toward high-quality spaces and assets. Consequently, landlords are offering better tenant improvement packages.
JLL cites several reasons for this trend, including the steady climb in construction costs, which increased on average by 15% last year. Landlords also offer better tenant improvement packages to offset the impact of higher rents.
The national average for tenant improvement allowances was $44 per sf, ranging from $105/sf in Washington D.C. to $28/sf in Nashville.
The report provides detailed snapshots of several markets, such as Austin, one of the country’s dynamic office markets, with robust growth supply. There are 3.1 million sf of new office space in Austin’s pipeline, 36% of which is preleased. The average tenant improvement allowance there last year was $45/sf.
There’s 7 million sf of new office space in the pipeline in San Francisco, where the office vacancy rate is 9.1%, and 68.8% of new space is preleased. The average tenant improvement allowance in San Francisco last year was $60/sf.
Related Stories

Office Buildings | May 1, 2023
Office building owners face potential legal liabilities when adding new workplace amenities
Many landlords in the war for tenants have turned to offering new amenities such as conference room services, fitness centers with nutritionists, and high-end food and beverage offerings. To provide new services, landlords often engage with third-party vendors, which can present thorny legal liability.

Design Innovation Report | Apr 27, 2023
BD+C's 2023 Design Innovation Report
Building Design+Construction’s Design Innovation Report presents projects, spaces, and initiatives—and the AEC professionals behind them—that push the boundaries of building design. This year, we feature four novel projects and one building science innovation.

Office Buildings | Apr 24, 2023
Smart savings: Commissioning for the hybrid workplace
Joe Crowe, Senior Mechanical Engineer, Gresham Smith, shares smart savings tips for facility managers and building owners of hybrid workplaces.
, Committee on the Environment (COTE)")
Green | Apr 21, 2023
Top 10 green building projects for 2023
The Harvard University Science and Engineering Complex in Boston and the Westwood Hills Nature Center in St. Louis are among the AIA COTE Top Ten Awards honorees for 2023.

Design Innovation Report | Apr 19, 2023
Reinforced concrete walls and fins stiffen and shade the National Bank of Kuwait skyscraper
When the National Bank of Kuwait first conceived its new headquarters more than a decade ago, it wanted to make a statement about passive design with a soaring tower that could withstand the extreme heat of Kuwait City, the country’s desert capital.

Design Innovation Report | Apr 19, 2023
Meet The Hithe: A demountable building for transient startups
The Hithe, near London, is designed to be demountable and reusable. The 2,153-sf building provides 12 units of business incubator workspace for startups.

Green | Apr 18, 2023
USGBC and IWBI unveil streamlined certification pathway for LEED and WELL green building programs
The U.S. Green Building Council, Green Business Certification Inc., and the International WELL Building Institute released a streamlined process for projects pursuing certifications for the LEED green building rating system and the WELL Building Standard. The new protocol simplifies documentation for projects that are pursuing both certifications at the same time or that have already earned one certification and are looking to add the other.

Office Buildings | Apr 13, 2023
L.A. headquarters for startup Califia Farms incorporates post-pandemic hybrid workplace design concepts
The new Los Angeles headquarters for fast-growing Califia Farms, a brand of dairy alternative products, was designed by SLAM with the post-Covid hybrid work environment in mind. Located in Maxwell Coffee House, a historic production facility built in 1924 that has become a vibrant mixed-use complex, the office features a café bordered by generous meeting rooms.

Market Data | Apr 11, 2023
Construction crane count reaches all-time high in Q1 2023
Toronto, Seattle, Los Angeles, and Denver top the list of U.S/Canadian cities with the greatest number of fixed cranes on construction sites, according to Rider Levett Bucknall's RLB Crane Index for North America for Q1 2023.

Contractors | Apr 10, 2023
What makes prefabrication work? Factors every construction project should consider
There are many factors requiring careful consideration when determining whether a project is a good fit for prefabrication. JE Dunn’s Brian Burkett breaks down the most important considerations.


