

Construction employment decreased from December 2019 to December 2020 in more than half of the nation’s metro areas despite a surge in homebuilding and remodeling, according to an analysis of new government data that the Associated General Contractors of America released today. Association officials said large numbers of contractors are having to lay off workers once they complete projects that began before the pandemic because private owners and public agencies are hesitant to commit to new construction.
“A dearth of new construction work is forcing more and more contractors to lay off employees once they complete projects started before the pandemic hit in early 2020,” said Ken Simonson, the association’s chief economist. “Private nonresidential construction spending tumbled 10% from December 2019 to December 2020 and public work has been slowing since last March, according to recent Census Bureau data.”
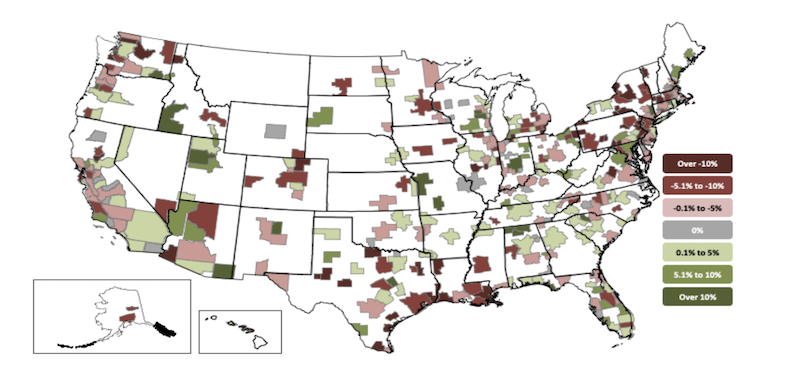
Construction employment fell in 191, or 53%, of 358 metro areas in 2020. Construction employment was stagnant in 33 additional metro areas, while only 134 metro areas—37%—added construction jobs between December 2019 and December 2020.
Houston-The Woodlands-Sugar Land, Texas lost the largest number of construction jobs in 2020 (-24,500 jobs, -10%), followed by New York City (-19,100 jobs, -12%); Midland, Texas (-9,200 jobs, -23%); Montgomery-Bucks-Chester counties, Pa. (-9,100 jobs, -17%); and Denver-Aurora-Lakewood, Colo. (-6,900 jobs, -6%). Brockton-Bridgewater-Easton, Mass. had the largest percentage decline (-40%, -2,100 jobs), followed by Altoona, Pa. (-34%, -1,000 jobs); Bloomsburg-Berwick, Pa. (-33%, -400 jobs); Johnstown, Pa. (-29%, -700 jobs); and East Stroudsburg, Pa. (-26%, -500 jobs).
Indianapolis-Carmel-Anderson, Ind. added the most construction jobs over the year (5,600 jobs, 10%), followed by Northern Virginia (5,300 jobs, 7%); Seattle-Bellevue-Everett, Wash. (4,900 jobs, 5%); Baltimore-Columbia-Towson, Md. (4,800 jobs, 6%); and Kansas City, Mo. (3,300 jobs, 11%). Walla Walla, Wash. had the highest percentage increase (17%, 200 jobs), followed by Fond du Lac, Wisc. (16%, 500 jobs); Springfield, Mo. (15%, 1,400 jobs); and Dutchess-Putnam counties, N.Y.
(15%, 1,300 jobs).
Association officials said job losses are likely to widen as demand for non-residential construction suffers and state and local budget challenges undermine demand for public projects. They urged Washington officials to begin work on recovery measures to fund infrastructure and shore up local construction budgets. They added that the work on these new investments should start even as negotiations on a coronavirus relief package continue.
“Helping people now is important but planning to rebuild our economy is essential to recovering from the economic pain of the pandemic,” said Stephen E. Sandherr, the association’s chief executive officer. “It is not enough to just want a better economy; you have to build it.”
View the metro employment 12-month data, rankings, top 10, new highs and lows, map.
Related Stories
High-rise Construction | Jan 23, 2017
Growth spurt: A record-breaking 128 buildings of 200 meters or taller were completed in 2016
This marks the third consecutive record-breaking year for building completions over 200 meters.

Market Data | Jan 18, 2017
Fraud and risk incidents on the rise for construction, engineering, and infrastructure businesses
Seven of the 10 executives in the sector surveyed in the report said their company fell victim to fraud in the past year.

Market Data | Jan 18, 2017
Architecture Billings Index ends year on positive note
Architecture firms close 2016 with the strongest performance of the year.

Market Data | Jan 12, 2017
73% of construction firms plan to expand their payrolls in 2017
However, many firms remain worried about the availability of qualified workers.

Market Data | Jan 9, 2017
Trump market impact prompts surge in optimism for U.S. engineering firm leaders
The boost in firm leader optimism extends across almost the entire engineering marketplace.
Market Data | Jan 5, 2017
Nonresidential spending thrives in strong November spending report
Many construction firms have reported that they remain busy but have become concerned that work could dry up in certain markets in 2017 or 2018, says Anirban Basu, ABC Chief Economist.

Market Data | Dec 21, 2016
Architecture Billings Index up slightly in November
New design contracts also return to positive levels, signifying future growth in construction activity.
Market Data | Dec 21, 2016
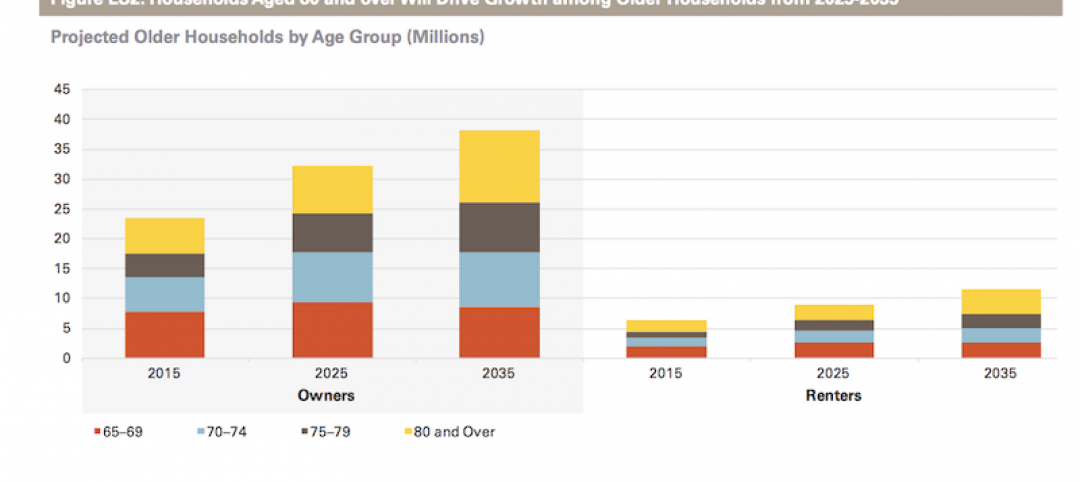
Will housing adjust to an aging population?
New Joint Center report projects 66% increase in senior heads of households by 2035.
Market Data | Dec 13, 2016
ABC predicts modest growth for 2017 nonresidential construction sector; warns of vulnerability for contractor
“The U.S. economy continues to expand amid a weak global economy and, despite risks to the construction industry, nonresidential spending should expand 3.5 percent in 2017,” says ABC Chief Economist Anirban Basu.
Market Data | Dec 2, 2016
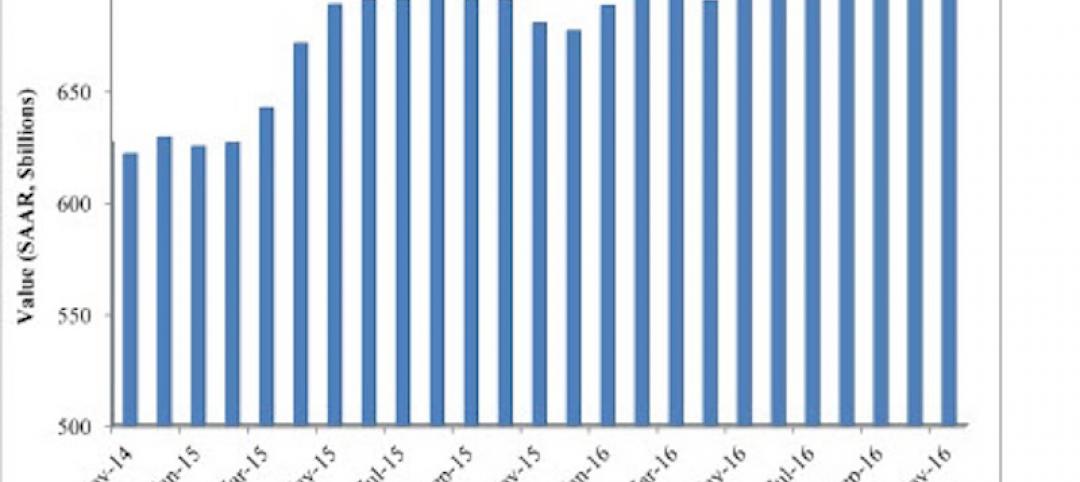
Nonresidential construction spending gains momentum
Nonresidential spending is now 2.6 percent higher than at the same time one year ago.


