

Construction employment decreased from December 2019 to December 2020 in more than half of the nation’s metro areas despite a surge in homebuilding and remodeling, according to an analysis of new government data that the Associated General Contractors of America released today. Association officials said large numbers of contractors are having to lay off workers once they complete projects that began before the pandemic because private owners and public agencies are hesitant to commit to new construction.
“A dearth of new construction work is forcing more and more contractors to lay off employees once they complete projects started before the pandemic hit in early 2020,” said Ken Simonson, the association’s chief economist. “Private nonresidential construction spending tumbled 10% from December 2019 to December 2020 and public work has been slowing since last March, according to recent Census Bureau data.”
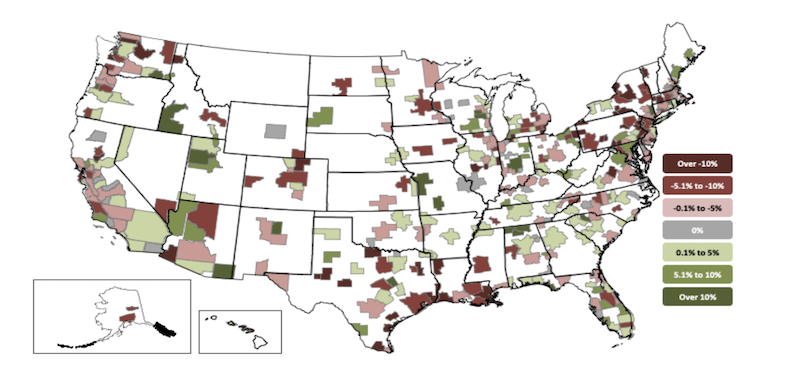
Construction employment fell in 191, or 53%, of 358 metro areas in 2020. Construction employment was stagnant in 33 additional metro areas, while only 134 metro areas—37%—added construction jobs between December 2019 and December 2020.
Houston-The Woodlands-Sugar Land, Texas lost the largest number of construction jobs in 2020 (-24,500 jobs, -10%), followed by New York City (-19,100 jobs, -12%); Midland, Texas (-9,200 jobs, -23%); Montgomery-Bucks-Chester counties, Pa. (-9,100 jobs, -17%); and Denver-Aurora-Lakewood, Colo. (-6,900 jobs, -6%). Brockton-Bridgewater-Easton, Mass. had the largest percentage decline (-40%, -2,100 jobs), followed by Altoona, Pa. (-34%, -1,000 jobs); Bloomsburg-Berwick, Pa. (-33%, -400 jobs); Johnstown, Pa. (-29%, -700 jobs); and East Stroudsburg, Pa. (-26%, -500 jobs).
Indianapolis-Carmel-Anderson, Ind. added the most construction jobs over the year (5,600 jobs, 10%), followed by Northern Virginia (5,300 jobs, 7%); Seattle-Bellevue-Everett, Wash. (4,900 jobs, 5%); Baltimore-Columbia-Towson, Md. (4,800 jobs, 6%); and Kansas City, Mo. (3,300 jobs, 11%). Walla Walla, Wash. had the highest percentage increase (17%, 200 jobs), followed by Fond du Lac, Wisc. (16%, 500 jobs); Springfield, Mo. (15%, 1,400 jobs); and Dutchess-Putnam counties, N.Y.
(15%, 1,300 jobs).
Association officials said job losses are likely to widen as demand for non-residential construction suffers and state and local budget challenges undermine demand for public projects. They urged Washington officials to begin work on recovery measures to fund infrastructure and shore up local construction budgets. They added that the work on these new investments should start even as negotiations on a coronavirus relief package continue.
“Helping people now is important but planning to rebuild our economy is essential to recovering from the economic pain of the pandemic,” said Stephen E. Sandherr, the association’s chief executive officer. “It is not enough to just want a better economy; you have to build it.”
View the metro employment 12-month data, rankings, top 10, new highs and lows, map.
Related Stories

Senior Living Design | May 9, 2017
Designing for a future of limited mobility
There is an accessibility challenge facing the U.S. An estimated 1 in 5 people will be aged 65 or older by 2040.

Industry Research | May 4, 2017
How your AEC firm can go from the shortlist to winning new business
Here are four key lessons to help you close more business.

Engineers | May 3, 2017
At first buoyed by Trump election, U.S. engineers now less optimistic about markets, new survey shows
The first quarter 2017 (Q1/17) of ACEC’s Engineering Business Index (EBI) dipped slightly (0.5 points) to 66.0.

Market Data | May 2, 2017
Nonresidential Spending loses steam after strong start to year
Spending in the segment totaled $708.6 billion on a seasonally adjusted, annualized basis.

Market Data | May 1, 2017
Nonresidential Fixed Investment surges despite sluggish economic in first quarter
Real gross domestic product (GDP) expanded 0.7 percent on a seasonally adjusted annualized rate during the first three months of the year.

Industry Research | Apr 28, 2017
A/E Industry lacks planning, but still spending large on hiring
The average 200-person A/E Firm is spending $200,000 on hiring, and not budgeting at all.

Market Data | Apr 19, 2017
Architecture Billings Index continues to strengthen
Balanced growth results in billings gains in all regions.

Market Data | Apr 13, 2017
2016’s top 10 states for commercial development
Three new states creep into the top 10 while first and second place remain unchanged.

Market Data | Apr 6, 2017
Architecture marketing: 5 tools to measure success
We’ve identified five architecture marketing tools that will help your firm evaluate if it’s on the track to more leads, higher growth, and broader brand visibility.

Market Data | Apr 3, 2017
Public nonresidential construction spending rebounds; overall spending unchanged in February
The segment totaled $701.9 billion on a seasonally adjusted annualized rate for the month, marking the seventh consecutive month in which nonresidential spending sat above the $700 billion threshold.


