


Toronto, Seattle, Los Angeles, and Denver top the list of U.S/Canadian cities with the greatest number of fixed construction cranes on construction sites, according to Rider Levett Bucknall's RLB Crane Index for North America for Q1 2023.
Toronto had a whopping 238 cranes in place in the first quarter. Seattle had 51 cranes to lead all U.S. cities, followed by Los Angeles (47), Denver (36), and Washington, D.C. (26).
The RLB survey reports a nominal increase of 7.04% (34 cranes) from the Q3 2022 edition of the RLB Crane Index. Of the 14 cities surveyed, eight experienced
an increase in cranes, two decreased, and four held steady.
The three top sectors across all cities are residential (51%), mixed use (22%), and commercial (12%).
"Despite continued workforce challenges and economic uncertainties are still concerns for the coming year, we are continuing to see new projects break ground within our 14-key markets. This indicates that investments are continuing to be made into our cities," said the report's authors.
"Notwithstanding concerns for the housing market, residential and mixed-use projects make up 73% of the overall count. We anticipate the number of cranes to remain high into 2023. Despite uncertain market conditions, construction projects will continue to break ground, albeit at a cost," the added.
About the RLB Crane Index
Rider Levett Bucknall’s Crane Index for North America is published biannually. It tracks the number of operating tower cranes in 14 major cities across the U.S. and Canada. The index was the first of its kind, and unlike other industry barometers that track cost and other financial data, the Crane Index tracks the number of fixed cranes on construction sites and gives a simplified measure of the current state of the construction industry’s workload in each location.
Related Stories
Market Data | Sep 15, 2021
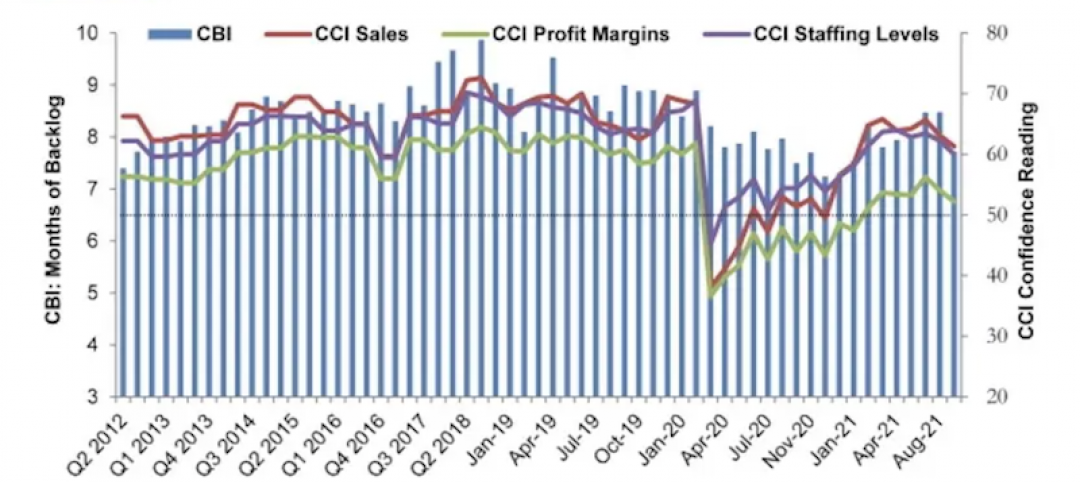
ABC’s Construction Backlog Indicator plummets in August; Contractor Confidence down
ABC’s Construction Confidence Index readings for sales, profit margins and staffing levels all fell modestly in August.
Market Data | Sep 7, 2021
Construction sheds 3,000 jobs in August
Gains are limited to homebuilding as other contractors struggle to fill both craft and salaried positions.
Market Data | Sep 3, 2021
Construction workforce shortages reach pre-pandemic levels
Coronavirus continues to impact projects and disrupt supply chains.

Multifamily Housing | Sep 1, 2021
Top 10 outdoor amenities at multifamily housing developments for 2021
Fire pits, lounge areas, and covered parking are the most common outdoor amenities at multifamily housing developments, according to new research from Multifamily Design+Construction.

Market Data | Sep 1, 2021
Construction spending posts small increase in July
Coronavirus, soaring costs, and supply disruptions threaten to erase further gains.

Market Data | Sep 1, 2021
Bradley Corp. survey finds office workers taking coronavirus precautions
Due to the rise in new strains of the virus, 70% of office workers have implemented a more rigorous handwashing regimen versus 59% of the general population.
Market Data | Aug 31, 2021
Three out of four metro areas add construction jobs from July 2020 to July 2021
COVID, rising costs, and supply chain woes may stall gains.
Market Data | Aug 24, 2021
July construction employment lags pre-pandemic peak in 36 states
Delta variant of coronavirus threatens to hold down further gains.

Market Data | Aug 17, 2021
Demand for design activity continues to expand
The ABI score for July was 54.6.

Market Data | Aug 12, 2021
Steep rise in producer prices for construction materials and services continues in July.
The producer price index for new nonresidential construction rose 4.4% over the past 12 months.


