


Toronto, Seattle, Los Angeles, and Denver top the list of U.S/Canadian cities with the greatest number of fixed construction cranes on construction sites, according to Rider Levett Bucknall's RLB Crane Index for North America for Q1 2023.
Toronto had a whopping 238 cranes in place in the first quarter. Seattle had 51 cranes to lead all U.S. cities, followed by Los Angeles (47), Denver (36), and Washington, D.C. (26).
The RLB survey reports a nominal increase of 7.04% (34 cranes) from the Q3 2022 edition of the RLB Crane Index. Of the 14 cities surveyed, eight experienced
an increase in cranes, two decreased, and four held steady.
The three top sectors across all cities are residential (51%), mixed use (22%), and commercial (12%).
"Despite continued workforce challenges and economic uncertainties are still concerns for the coming year, we are continuing to see new projects break ground within our 14-key markets. This indicates that investments are continuing to be made into our cities," said the report's authors.
"Notwithstanding concerns for the housing market, residential and mixed-use projects make up 73% of the overall count. We anticipate the number of cranes to remain high into 2023. Despite uncertain market conditions, construction projects will continue to break ground, albeit at a cost," the added.
About the RLB Crane Index
Rider Levett Bucknall’s Crane Index for North America is published biannually. It tracks the number of operating tower cranes in 14 major cities across the U.S. and Canada. The index was the first of its kind, and unlike other industry barometers that track cost and other financial data, the Crane Index tracks the number of fixed cranes on construction sites and gives a simplified measure of the current state of the construction industry’s workload in each location.
Related Stories
Market Data | Oct 14, 2021
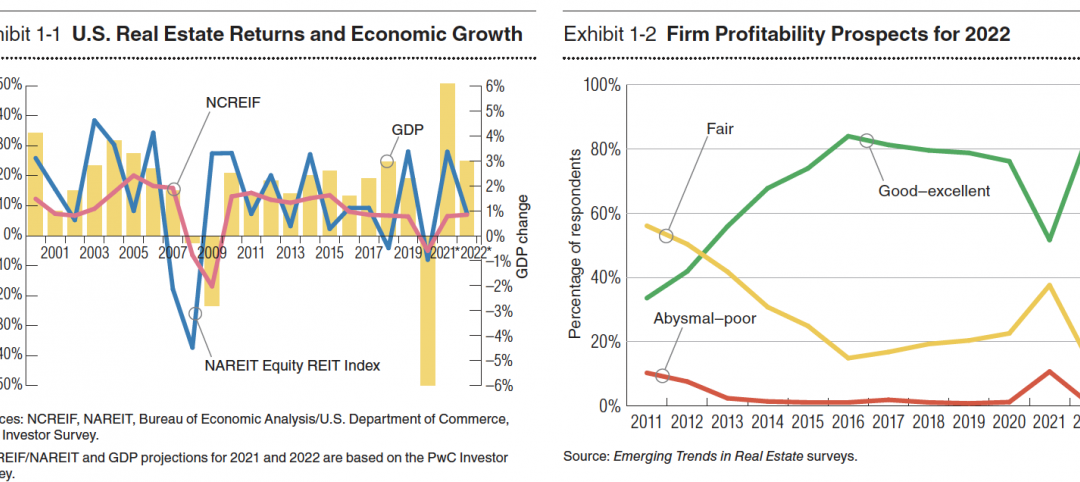
Climate-related risk could be a major headwind for real estate investment
A new trends report from PwC and ULI picks Nashville as the top metro for CRE prospects.
Market Data | Oct 14, 2021
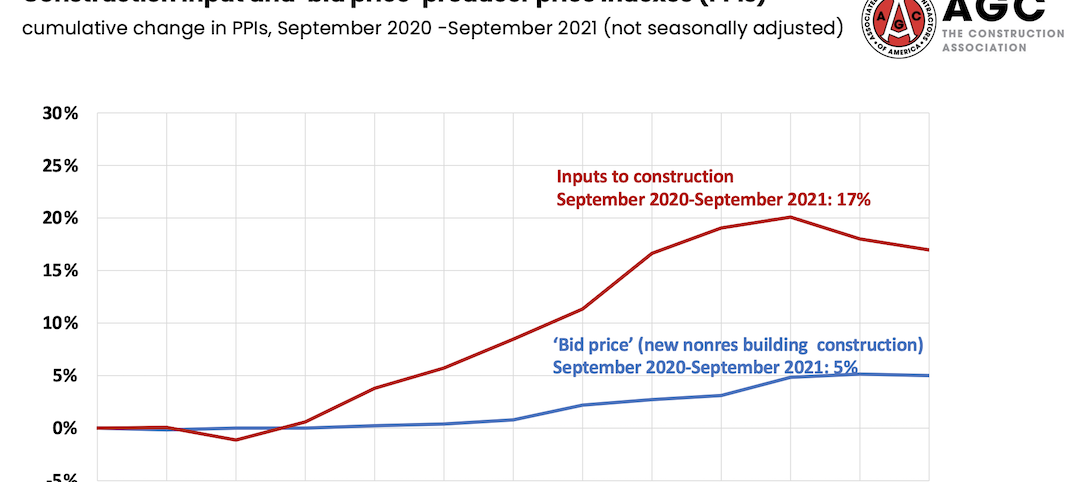
Prices for construction materials continue to outstrip bid prices over 12 months
Construction officials renew push for immediate removal of tariffs on key construction materials.
Market Data | Oct 11, 2021
No decline in construction costs in sight
Construction cost gains are occurring at a time when nonresidential construction spending was down by 9.5 percent for the 12 months through July 2021.
Market Data | Oct 11, 2021
Nonresidential construction sector posts first job gain since March
Has yet to hit pre-pandemic levels amid supply chain disruptions and delays.
Market Data | Oct 4, 2021
Construction spending stalls between July and August
A decrease in nonresidential projects negates ongoing growth in residential work.
Market Data | Oct 1, 2021
Nonresidential construction spending dips in August
Spending declined on a monthly basis in 10 of the 16 nonresidential subcategories.
Market Data | Sep 29, 2021
One-third of metro areas lost construction jobs between August 2020 and 2021
Lawrence-Methuen Town-Salem, Mass. and San Diego-Carlsbad, Calif. top lists of metros with year-over-year employment increases.
Market Data | Sep 28, 2021
Design-Build projects should continue to take bigger shares of construction spending pie over next five years
FMI’s new study finds collaboration and creativity are major reasons why owners and AEC firms prefer this delivery method.
Market Data | Sep 22, 2021
Architecture billings continue to increase
The ABI score for August was 55.6, up from July’s score of 54.6.
Market Data | Sep 20, 2021
August construction employment lags pre-pandemic peak in 39 states
The coronavirus delta variant and supply problems hold back recovery.


