

Providing more evidence of a strengthening economy, Associated Builders and Contractors’ (ABC) Construction Backlog Indicator (CBI) set a record as it expanded to 9.45 months during the third quarter of 2017, up 9.8 percent from the second quarter to the longest backlog reading in the eight-year history of the series. CBI is up by 0.8 months, or 9.2 percent, on a year-over-year basis.
CBI is a leading economic indicator that reflects the amount of construction work under contract, but not yet completed. CBI is measured in months, with a lengthening backlog implying expanding demand for construction services.
“The latest backlog reading strongly suggests the post-2009 economic recovery is picking up steam and that the current construction spending cycle, in place since early 2011 for many contractors, is not on the verge of concluding,” said Basu. “Indeed, if anything, the CBI indicates that nonresidential construction firms are becoming busier due to a confluence of factors, including growing business confidence over the past year and a recent rise in energy prices, which is supporting more investment among energy explorers, producers and distributors.
“With economic growth picking up recently, interest rates staying low, asset prices remaining high and confidence elevated among consumers and businesses alike, the nonresidential construction cycle stands to get even hotter in the near term. That should represent a source of joy to contractors, but undoubtedly many are unnerved by growing pressures to secure suitably trained craftspeople who can support on-time, on-budget project delivery. The upshot is that wage pressures will continue to build in the U.S. construction industry. However, based on the most recent CBI, increasing delivery costs have not yet begun to meaningfully slow the nonresidential construction sector’s ongoing expansion cycle.”

Highlights by Region
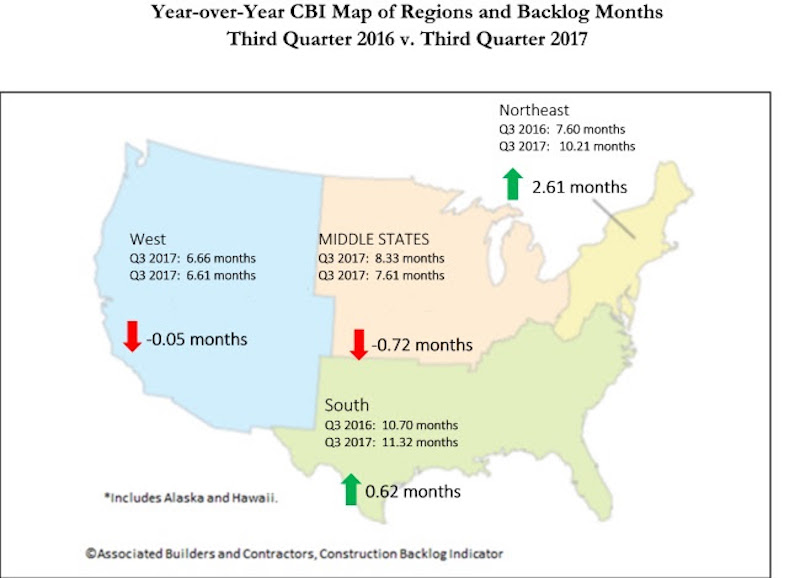
⦁ Backlog in the South surged to 11.3 months during the third quarter, the highest reading in the history of the series. Many will conclude that this is at least partially due to the storms that raced across Texas, Florida and other communities during the quarter, but there are other factors at work, including the ongoing boom in commercial construction in the Dallas, Atlanta and Miami metropolitan areas.
⦁ Increased activity in major cities along the Boston-to-Washington corridor continued to drive backlog data higher in the Northeast. At 10.2 months, the Northeast has matched its lengthiest backlog in the history of the series, in the fourth quarter of 2014.
⦁ Backlog in the Middle States, where growth has been softer in places like Illinois and Kansas, shrank by 0.3 months during the third quarter. Still, regional backlog can be characterized as stable.
⦁ Backlog in the West was slightly shorter during the third quarter and stands at roughly the same level as one year ago. Given the elevated levels of construction apparent in markets like Las Vegas, Portland and San Jose, one can only conclude that the region’s lower average backlog level compared to other regions is at least partially attributable to a very competitive environment associated with an entrepreneurial climate that spawns more start-up construction firms than other parts of the country. Wildfires impacting much of California also likely stalled a certain level of construction and contractual activity during the third quarter.

Highlights by Industry
⦁ Backlog in the commercial/institutional segment expanded briskly, increasing by nearly a full month during the third quarter, and now stands at 9.31 months.
⦁ Average backlog in the heavy industrial category fell to 4.46 months during the third quarter, continuing what has been two years of steady shrinkage aligned with observed declines in construction spending related to U.S. manufacturing.
⦁ Backlog in the infrastructure category expanded during the third quarter to 12.53 months, the highest reading on record for the segment and an indication that improving state and local government finances may finally be translating into higher capital spending.
Highlights by Company Size
⦁ Large firms, those with annual revenues in excess of $100 million, experienced a collective average backlog increase to 13.8 months during the third quarter. Despite the sharp quarterly rise, backlog in the category is virtually unchanged from the same time one year ago.
⦁ Backlog among firms with annual revenues between $50 million and $100 million also surged during the third quarter, increasing by more than two months. Backlog in this category stands at levels last observed in 2013 when the construction recovery began to heat up in earnest.
⦁ Backlog among firms with between $30 million and $50 million in annual revenues lengthened modestly to 11.4 months during the third quarter, the third highest reading on record.
⦁ Backlog for firms with annual revenues less than $30 million remain remarkably stable at 7.7 months. For the past eleven quarters, backlog for this group, which is heavily tilted toward subcontractors, has remained between 7.2 and 8.1 months.
Related Stories

Healthcare Facilities | Feb 18, 2021
The Weekly show, Feb 18, 2021: What patients want from healthcare facilities, and Post-COVID retail trends
This week on The Weekly show, BD+C editors speak with AEC industry leaders from JLL and Landini Associates about what patients want from healthcare facilities, based on JLL's recent survey of 4,015 patients, and making online sales work for a retail sector recovery.
Market Data | Feb 17, 2021
Soaring prices and delivery delays for lumber and steel squeeze finances for construction firms already hit by pandemic
Association officials call for removing tariffs on key materials to provide immediate relief for hard-hit contractors and exploring ways to expand long-term capacity for steel, lumber and other materials,

Market Data | Feb 9, 2021
Construction Backlog and contractor optimism rise to start 2021, according to ABC member survey
Despite the monthly uptick, backlog is 0.9 months lower than in January 2020.

Market Data | Feb 9, 2021
USGBC top 10 states for LEED in 2020
The Top 10 States for LEED green building is based on gross square feet of certified space per person using 2010 U.S. Census data and includes commercial and institutional projects certified in 2020.

Market Data | Feb 8, 2021
Construction employment stalls in January with unemployment rate of 9.4%
New measures threaten to undermine recovery.
Market Data | Feb 4, 2021
Construction employment declined in 2020 in majority of metro areas
Houston-The Woodlands-Sugar Land and Brockton-Bridgewater-Easton, Mass. have worst 2020 losses, while Indianapolis-Carmel-Anderson, Ind. and Walla Walla, Wash. register largest gains in industry jobs.

Market Data | Feb 3, 2021
Construction spending diverges in December with slump in private nonresidential sector, mixed public work, and boom in homebuilding
Demand for nonresidential construction and public works will decline amid ongoing pandemic concerns.

Market Data | Feb 1, 2021
The New York City market is back on top and leads the U.S. hotel construction pipeline
New York City has the greatest number of projects under construction with 108 projects/19,439 rooms.
Market Data | Jan 29, 2021
Multifamily housing construction outlook soars in late 2020
Exceeds pre-COVID levels, reaching highest mark since 1st quarter 2018.
Market Data | Jan 29, 2021
The U.S. hotel construction pipeline stands at 5,216 projects/650,222 rooms at year-end 2020
At the end of Q4 ‘20, projects currently under construction stand at 1,487 projects/199,700 rooms.


