

Continuing the positive momentum of a nearly three-point bump in January, the Architecture Billings Index (ABI) reached its first positive mark since February 2020, according to a new report today from The American Institute of Architects (AIA).
AIA’s ABI score for February was 53.3 compared to 44.9 in January (any score above 50 indicates an increase in billings). February also marked the first time the design contract score rose back into positive territory since the pandemic began with a score of 51.6 compared to 48.8 in January. The new project inquiries score for February reached a 22-month high water mark with a score of 61.2 compared to 56.8 in January.
“Hopefully, this is the start of a more sustained recovery. It is possible that scores will continue to bounce above and below 50 for the next few months, as recoveries often move in fits and starts,” said AIA Chief Economist, Kermit Baker, Hon. AIA, PhD. “Beyond the encouraging billing data, architecture employment added 700 new positions in January and has now regained 45 percent of the jobs that were lost since the beginning of the pandemic.”
Key ABI highlights for February include:
• Regional averages: South (52.4); West (49.5); Midwest (49.3); Northeast (46.9)
• Sector index breakdown: mixed practice (52.5); commercial/industrial (50.5); multi-family residential (48.3); institutional (47.8)
• Project inquiries index: 61.2
• Design contracts index: 51.6
The regional and sector categories are calculated as a three-month moving average, whereas the national index, design contracts and inquiries are monthly numbers.
Visit AIA’s website for more ABI information.
Related Stories
Industry Research | Aug 29, 2019
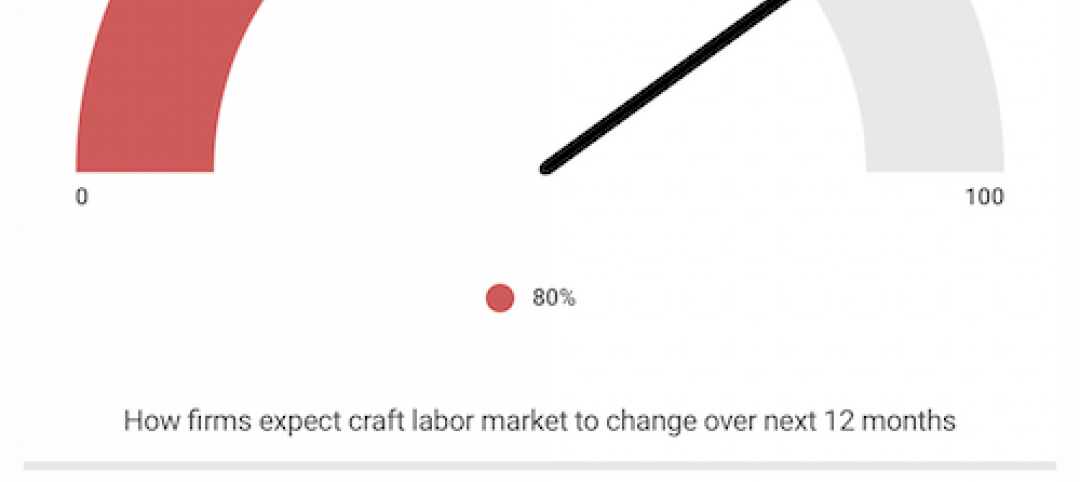
Construction firms expect labor shortages to worsen over the next year
A new AGC-Autodesk survey finds more companies turning to technology to support their jobsites.
Market Data | Aug 21, 2019
Architecture Billings Index continues its streak of soft readings
Decline in new design contracts suggests volatility in design activity to persist.
Market Data | Aug 19, 2019
Multifamily market sustains positive cycle
Year-over-year growth tops 3% for 13th month. Will the economy stifle momentum?

Market Data | Aug 16, 2019
Students say unclean restrooms impact their perception of the school
The findings are part of Bradley Corporation’s Healthy Hand Washing Survey.

Market Data | Aug 12, 2019
Mid-year economic outlook for nonresidential construction: Expansion continues, but vulnerabilities pile up
Emerging weakness in business investment has been hinting at softening outlays.
Market Data | Aug 7, 2019
National office vacancy holds steady at 9.7% in slowing but disciplined market
Average asking rental rate posts 4.2% annual growth.
Market Data | Aug 1, 2019
Nonresidential construction spending slows in June, remains elevated
Among the 16 nonresidential construction spending categories tracked by the Census Bureau, seven experienced increases in monthly spending.

Market Data | Jul 31, 2019
For the second quarter of 2019, the U.S. hotel construction pipeline continued its year-over-year growth spurt
The growth spurt continued even as business investment declined for the first time since 2016.
Market Data | Jul 23, 2019
Despite signals of impending declines, continued growth in nonresidential construction is expected through 2020
AIA’s latest Consensus Construction Forecast predicts growth.

Market Data | Jul 20, 2019
Construction costs continued to rise in second quarter
Labor availability is a big factor in that inflation, according to Rider Levett Bucknall report.


