


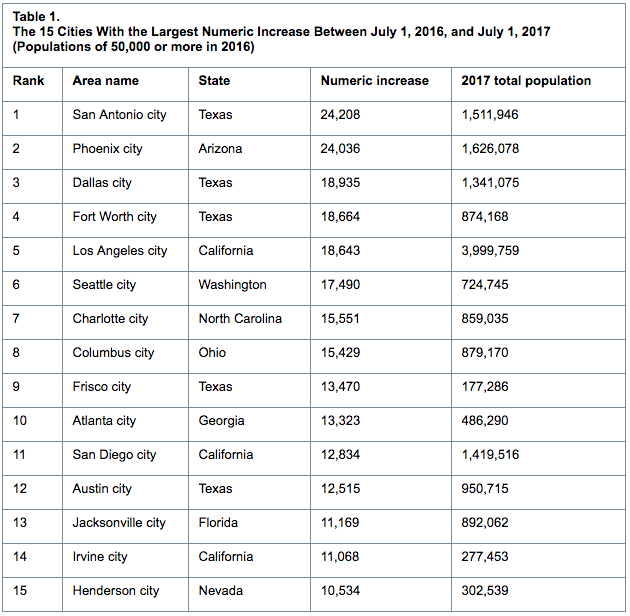
Eight of the 15 cities or towns with the largest population gains were located in the South in 2017, with three of the top five in Texas, according to new population estimates released by the U.S. Census Bureau.
“San Antonio, Texas, tops the list with the largest population gain with an increase of over 24,200 people, an average of 66 people per day between 2016 and 2017,” said Amel Toukabri, a demographer in the Population Division of the Census Bureau. “That’s a growth rate of 1.6%. This growth was enough to push San Antonio's population above the 1.5 million mark.”
Some of the other cities with the largest population gains were Phoenix, Ariz. (24,000); Dallas, Texas (18,900); Fort Worth, Texas (18,700); Los Angeles, Calif. (18,600); Seattle, Washington (17,500); and Charlotte, N.C. (15,600).
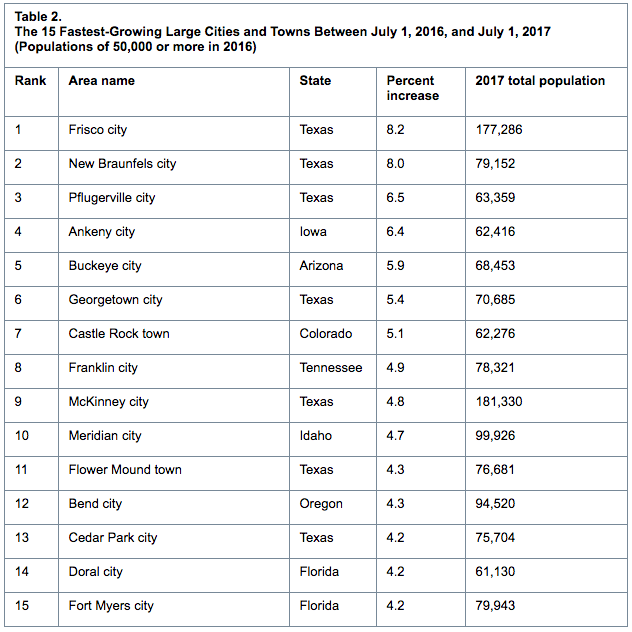
Regarding percentage change in population, 10 of the 15 fastest-growing large cities were located in the South, with seven in Texas. Between 2016 and 2017, Frisco, Texas (near Dallas), was the fastest-growing large city (population of 50,000 or more) at 8.2%, making its growth rate more than 11 times faster than the nation’s growth rate of 0.7%.
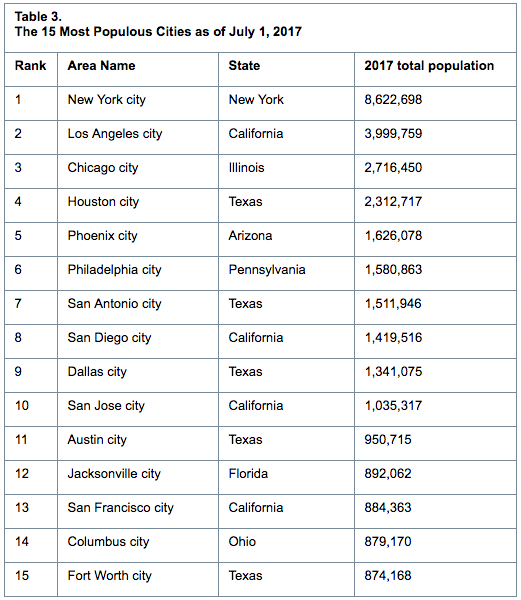
Fort Worth, Texas, surpassed Indianapolis, Ind., becoming the 15th largest city in the United States with a population of 874,168. Indianapolis has a population of 863,002. The 14 largest U.S.cities have not changed since 2016.
 Source: U.S. Census Bureau
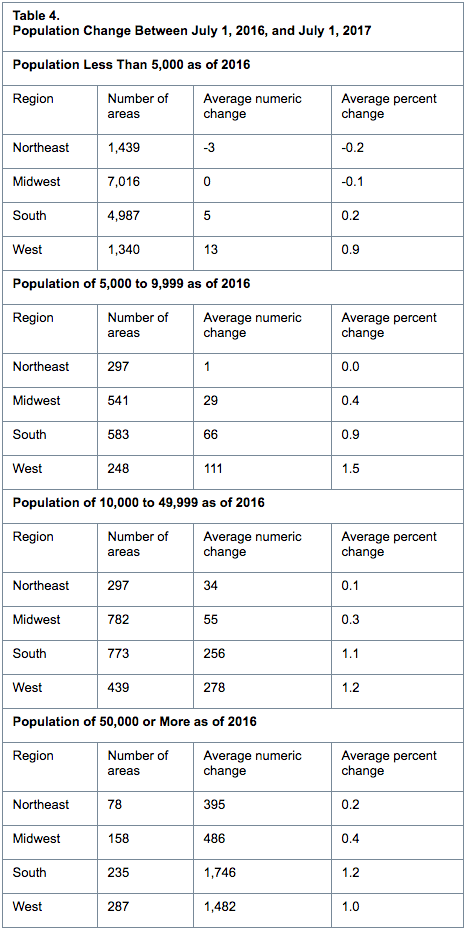
While the main focus of this release has been on the 3.9% of cities with populations of 50,000 or more, the United States is a nation of small towns. Of the nation’s 325.7 million people, an estimated 205.0 million (62.9%) live within an incorporated place as of July 1, 2017. Of approximately 19,500 incorporated places, about 76% had fewer than 5,000 people and nearly 50% had fewer than 1,000 people.
Regional Growth
The West had the highest share of its population living within an incorporated place (76.7%), followed by the Midwest (71.4%) as of July 1, 2017. The Northeast had the smallest population of its residents living in incorporated places (51.4%).
The South had the most city dwellers of any region at 67.9 million. However, this accounted for only 54.9% of the South’s 123.7 million total population. Since the 2010 Census, large cities in the South and West have led the nation in population growth, with an average increase of 10.0% (16,206) and 7.8% (12,256), respectively. By comparison, those in the Northeast and Midwest grew on average by 2.2% (9,104) and 3.0% (3,942), respectively.
The nation’s housing stock grew by more than one million last year, reaching over 137 million units. The growth rate of 0.8% from 2016 to 2017 was slower than the 1.4% a decade ago between 2006 and 2007.
 Source: U.S. Census Bureau
Housing unit growth last year remained below 2007 levels in nearly all states except North Dakota (up 1.0% last year, compared to a 0.9% increase in 2007); the District of Columbia (up 1.1%, compared to a 0.9% increase in 2007); South Dakota (up 1.4%, compared to a 1.2% increase in 2007); Iowa (up 0.9%, compared to a 0.7% increase in 2007); and Nebraska (returned to the 2007 growth rate of 0.8%).
Between July 1, 2016, and July 1, 2017, Utah was the fastest-growing state in terms of housing units, with an increase of 2.1%. Idaho and Colorado were the second- and third-fastest growing states with increases of 1.7% and 1.6%, respectively. West Virginia and Rhode Island were tied as the slowest-growing states with increases of 0.2%.
The nation’s housing stock increased by 5.7 million units (4.3%) since April 1, 2010. North Dakota was the fastest-growing state in terms of housing units, with an increase of 18.0% during the same period. Rounding out the top five states in percent gain were Utah (10.7%), Texas (9.6%), Idaho (8.1%) and South Dakota (8.0%).
Fourteen states added more than 100,000 housing units between April 1, 2010, and July 1, 2017. In terms of the largest numeric increase, the top five were Texas (955,000), California (497,000), Florida (452,000), North Carolina (295,000) and New York (219,000).
 Source: U.S. Census Bureau
 Source: U.S. Census Bureau
Related Stories

Market Data | Jan 31, 2022
Canada's hotel construction pipeline ends 2021 with 262 projects and 35,325 rooms
At the close of 2021, projects under construction stand at 62 projects/8,100 rooms.

Market Data | Jan 27, 2022
Record high counts for franchise companies in the early planning stage at the end of Q4'21
Through year-end 2021, Marriott, Hilton, and IHG branded hotels represented 585 new hotel openings with 73,415 rooms.

Market Data | Jan 27, 2022
Dallas leads as the top market by project count in the U.S. hotel construction pipeline at year-end 2021
The market with the greatest number of projects already in the ground, at the end of the fourth quarter, is New York with 90 projects/14,513 rooms.

Market Data | Jan 26, 2022
2022 construction forecast: Healthcare, retail, industrial sectors to lead ‘healthy rebound’ for nonresidential construction
A panel of construction industry economists forecasts 5.4 percent growth for the nonresidential building sector in 2022, and a 6.1 percent bump in 2023.

Market Data | Jan 24, 2022
U.S. hotel construction pipeline stands at 4,814 projects/581,953 rooms at year-end 2021
Projects scheduled to start construction in the next 12 months stand at 1,821 projects/210,890 rooms at the end of the fourth quarter.

Market Data | Jan 19, 2022
Architecture firms end 2021 on a strong note
December’s Architectural Billings Index (ABI) score of 52.0 was an increase from 51.0 in November.

Market Data | Jan 13, 2022
Materials prices soar 20% in 2021 despite moderating in December
Most contractors in association survey list costs as top concern in 2022.

Market Data | Jan 12, 2022
Construction firms forsee growing demand for most types of projects
Seventy-four percent of firms plan to hire in 2022 despite supply-chain and labor challenges.

Market Data | Jan 7, 2022
Construction adds 22,000 jobs in December
Jobless rate falls to 5% as ongoing nonresidential recovery offsets rare dip in residential total.

Market Data | Jan 6, 2022
Inflation tempers optimism about construction in North America
Rider Levett Bucknall’s latest report cites labor shortages and supply chain snags among causes for cost increases.


