


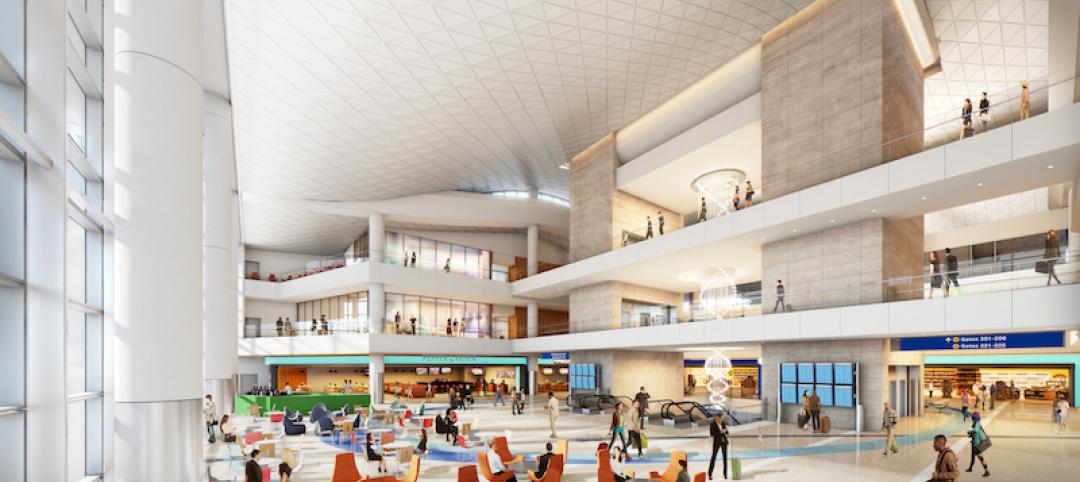
The recent evolution of airport terminals has been prompted largely by different patterns of passenger behavior in a post-9/11 world. Passengers have learned get to the airport earlier. They spend less time browsing pre-security retail, opting to queue up in often-lengthy security lines well before boarding. The result? Overcrowding in post-security areas, where retail and dining options have historically been lacking.
Curtis Fentress, Principal-in-Charge of design at Fentress Architects, says greater passenger volume has strained gate and restroom capabilities. In addition, the recent popularity of low-cost airlines has increased demand for post-security dining options.
“Many carriers don’t provide any food on the airplane,” Fentress says. “So the people who are getting to the airport earlier to make sure they get through security are waiting, and they want something to eat. If there’s any kind of flight delay, they know they might be stuck in the airport or stuck up in the air for a while without any food.”
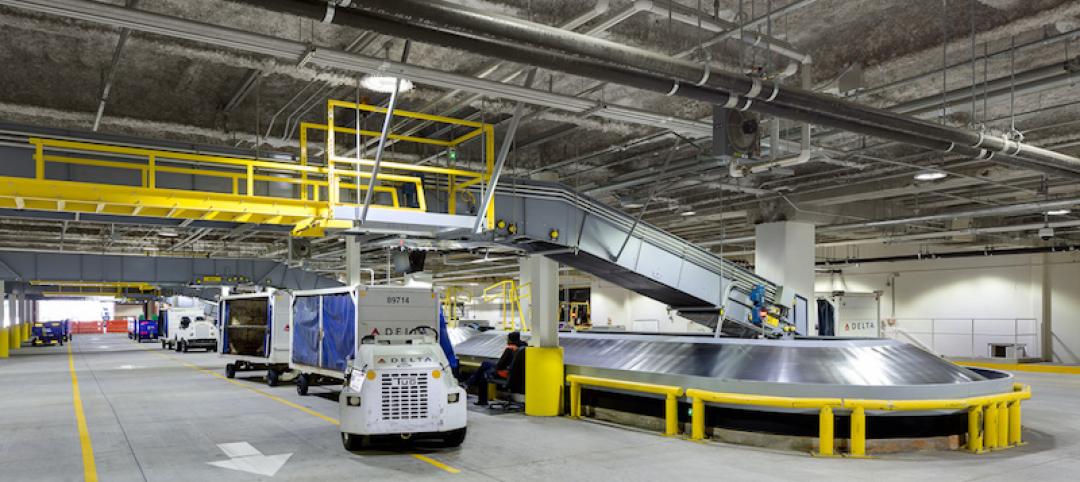
Airports are scrambling to respond with renovations and new terminals, even as they deal with TSA rules that can change in an instant. From CTX scanners—van-sized x-ray machines used to examine checked bags—to passenger scanners, the range of large equipment that terminals must accommodate just keeps morphing. Building Teams and their clients are adopting structural tactics that support change.
“We’re using more steel, which allows us to make longer distances between columns,” Fentress says. “The more long-span construction you can do, the more flexibility you have in the future.”
Top Air Terminal Sector Architecture Firms
| Rank | Company | 2013 Air Terminal Revenue Revenue |
| 1 | HOK | $47,074,837 |
| 2 | Gensler | 35,675,000 |
| 3 | Kohn Pedersen Fox Associates | 30,792,300 |
| 4 | Corgan | 26,376,420 |
| 5 | Fentress Architects | 26,333,785 |
| 6 | Stantec | 22,650,631 |
| 7 | RS&H | 22,050,000 |
| 8 | Skidmore, Owings & Merrill | 20,454,225 |
| 9 | PGAL | 17,120,000 |
| 10 | Heery International | 13,057,793 |
| 11 | HNTB Corp. | 10,900,639 |
| 12 | Leo A Daly | 9,490,737 |
| 13 | Gresham, Smith and Partners | 6,733,000 |
| 14 | SchenkelShultz Architecture | 6,179,000 |
| 15 | HKS | 4,087,622 |
| 16 | LS3P | 3,282,241 |
| 17 | Morris Architects | 2,795,000 |
| 18 | Clark Nexsen | 2,214,183 |
| 19 | Solomon Cordwell Buenz | 1,700,000 |
| 20 | CTA Architects Engineers | 1,187,913 |
| 21 | ZGF Architects | 929,658 |
| 22 | BRPH | 925,000 |
| 23 | Epstein | 762,000 |
| 24 | RTKL Associates | 677,000 |
| 25 | Integrus Architecture | 641,695 |
| 26 | Ware Malcomb | 196,500 |
| 27 | Rosser International | 158,668 |
| 28 | JRS Architect | 135,000 |
| 29 | Environetics | 112,443 |
| 30 | Parkhill, Smith & Cooper | 92,000 |
| 31 | Cuningham Group Architecture | 44,964 |
| 32 | Beyer Blinder Belle | 9,544 |
| 33 | Perkins+will | 6,836 |
| 34 | Ratio Architects | 5,368 |
Top Air Terminal Sector Engineering Firms
| Rank | Company | 2013 Air Terminal Revenue Revenue |
| 1 | Jacobs | $118,990,000 |
| 2 | URS Corp. | 83,069,612 |
| 3 | Burns & McDonnell | 48,010,000 |
| 4 | Parsons Brinckerhoff | 27,025,899 |
| 5 | Arup | 21,447,760 |
| 6 | Leidos | 16,810,000 |
| 7 | Ross & Baruzzini | 12,814,720 |
| 8 | AECOM Technology Corp. | 9,630,000 |
| 9 | STV | 5,260,000 |
| 10 | WSP Group | 3,640,000 |
| 11 | KPFF Consulting Engineers | 3,125,000 |
| 12 | Syska Hennessy Group | 2,933,760 |
| 13 | TLC Engineering for Architecture | 1,984,605 |
| 14 | TTG | 1,653,250 |
| 15 | Thornton Tomasetti | 1,620,411 |
| 16 | Walter P Moore and Associates | 1,596,212 |
| 17 | Sparling | 1,583,537 |
| 18 | Stanley Consultants | 1,526,482 |
| 19 | Aon Fire Protection Engineering Corp. | 1,500,000 |
| 20 | Graef | 1,267,799 |
| 21 | RMF Engineering | 1,200,000 |
| 22 | Coffman Engineers | 1,139,884 |
| 23 | Magnusson Klemencic Associates | 1,068,015 |
| 24 | RDK Engineers | 870,000 |
| 25 | Vanderweil Engineers | 856,900 |
| 26 | Wiss, Janney, Elstner Associates | 550,000 |
| 27 | Simpson Gumpertz & Heger | 550,000 |
| 28 | Martin/Martin | 494,691 |
| 29 | M-E Engineers | 400,000 |
| 30 | Newcomb & Boyd | 351,932 |
| 31 | Zak Companies | 351,488 |
| 32 | I. C. Thomasson Associates | 300,000 |
| 33 | Davis, Bowen & Friedel | 257,524 |
| 34 | Guernsey | 252,705 |
| 35 | Environmental Systems Design | 198,068 |
| 36 | CTLGroup | 180,000 |
| 37 | Joseph R. Loring & Associates | 175,000 |
| 38 | Heapy Engineering | 172,189 |
| 39 | Barge Waggoner Sumner & Cannon | 150,000 |
| 40 | GRW | 138,862 |
| 41 | Wallace Engineering | 131,000 |
| 42 | Dunham Associates | 90,000 |
| 43 | CJL Engineering | 81,400 |
| 44 | KJWW Engineering Consultants | 81,358 |
| 45 | P2S Engineering | 50,418 |
| 46 | Smith Seckman Reid | 44,419 |
| 47 | Bridgers & Paxton Consulting Engineers | 38,111 |
| 48 | Spectrum Engineers | 16,993 |
| 49 | Brinjac Engineering | 12,515 |
| 50 | French & Parrello Associates | 9,215 |
| 51 | AKF Group | 6,000 |
Top Air Terminal Sector Construction Firms
| Rank | Company | 2013 Air Terminal Revenue Revenue |
| 1 | Turner Construction | $487,680,000 |
| 2 | Hensel Phelps | 418,780,000 |
| 3 | PCL Construction | 328,069,635 |
| 4 | Walsh Group, The | 315,399,703 |
| 5 | Austin Commercial | 267,162,953 |
| 6 | Suffolk Construction | 170,270,605 |
| 7 | Balfour Beatty US | 154,058,403 |
| 8 | Clark Group | 131,741,104 |
| 9 | McCarthy Holdings | 127,000,000 |
| 10 | Manhattan Construction | 119,660,000 |
| 11 | Hunt Construction Group | 109,000,000 |
| 12 | URS Corp. | 83,069,612 |
| 13 | Hill International | 55,000,000 |
| 14 | Flintco | 54,400,000 |
| 15 | Walbridge | 46,000,000 |
| 16 | Skanska USA | 45,635,393 |
| 17 | Lend Lease | 35,107,000 |
| 18 | Weitz Company, The | 33,745,047 |
| 19 | HITT Contracting | 27,200,000 |
| 20 | Parsons Brinckerhoff | 27,025,899 |
| 21 | Brasfield & Gorrie | 25,926,312 |
| 22 | Gilbane | 22,031,250 |
| 23 | Tutor Perini Corp. | 19,320,308 |
| 24 | New South Construction | 18,923,000 |
| 25 | BlueScope Construction | 18,631,283 |
| 26 | O'Neil Industries/W.E. O'Neil | 18,433,037 |
| 27 | Holder Construction | 13,132,000 |
| 28 | Heery International | 13,057,793 |
| 29 | Yates Companies, The | 12,900,000 |
| 30 | Whiting-Turner Contracting Co., The | 11,991,159 |
| 31 | Beck Group, The | 11,096,174 |
| 32 | EMJ Corp. | 10,000,000 |
| 33 | James McHugh Construction | 9,527,392 |
| 34 | Robins & Morton | 6,370,178 |
| 35 | Messer Construction | 5,994,758 |
| 36 | W. M. Jordan Company | 5,812,917 |
| 37 | STV | 5,260,000 |
| 38 | Hill & Wilkinson | 4,766,000 |
| 39 | Consigli Construction | 3,278,099 |
| 40 | Kraus-Anderson Construction | 3,000,000 |
| 41 | Sundt Construction | 1,564,147 |
| 42 | JE Dunn Construction | 1,239,884 |
| 43 | Hoffman Construction | 1,000,000 |
| 44 | Hoar Construction | 4,000 |
Read BD+C's full 2014 Giants 300 Report
Related Stories
Airports | Feb 21, 2018
Terminal Modernization: Why Bother? Part II
This is the second post in our series examining why airport operators should bother to upgrade their facilities, even if capacity isn’t forcing the issue.
Airports | Feb 7, 2018
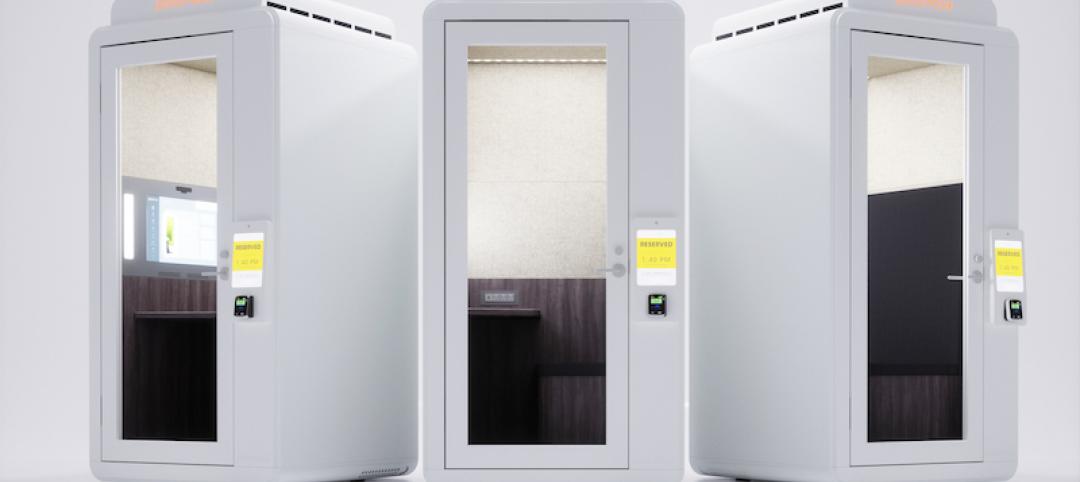
LaGuardia Airport receives eight private work booths in Terminal B
The hub sees over 15 million travelers annually.
Libraries | Jan 29, 2018
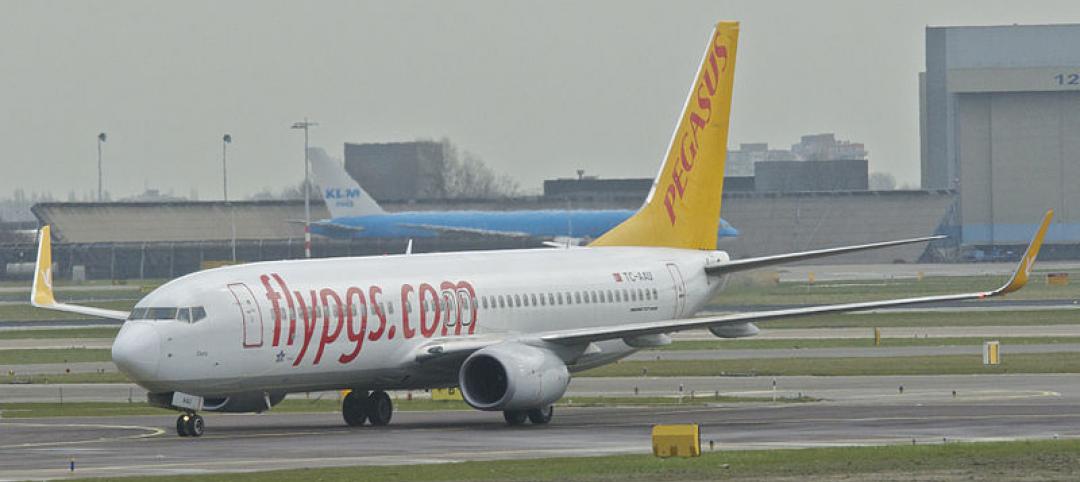
Commercial plane that skidded off the runway may become Turkey’s newest public library
The plane was removed from its cliffside perch five days after the incident.
Giants 400 | Oct 5, 2017
On wings of gold: Alternative financing schemes are propelling the high-flyin’ air terminals sector
The $4 billion renovation of New York City’s LaGuardia Airport is the first major U.S. aviation project delivered using a public-private partnership (P3) model.
Giants 400 | Oct 3, 2017
Top 30 airport engineering firms
AECOM, Burns & McDonnell, and Arup top BD+C’s ranking of the nation’s largest airport sector engineering and EA firms, as reported in the 2017 Giants 300 Report.

Airports | Sep 11, 2017
Terminal modernization: Why bother? Part I
A terminal modernization program can be a complicated and expensive task that airport operators may be hesitant to undertake unless necessitated by demands for increased capacity. This is the first post in our series examining why airport operators should bother to upgrade their facilities, even if capacity isn’t forcing the issue.
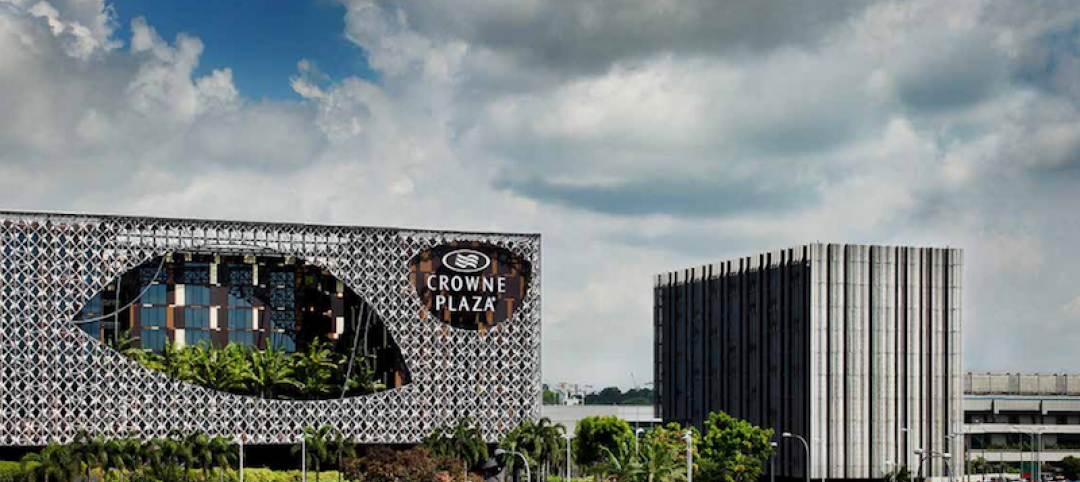
Hotel Facilities | Jul 5, 2017
It only took 26 days to complete construction on the Crowne Plaza Changi Airport hotel extension
PPVC techniques allowed the project to save time and manpower.
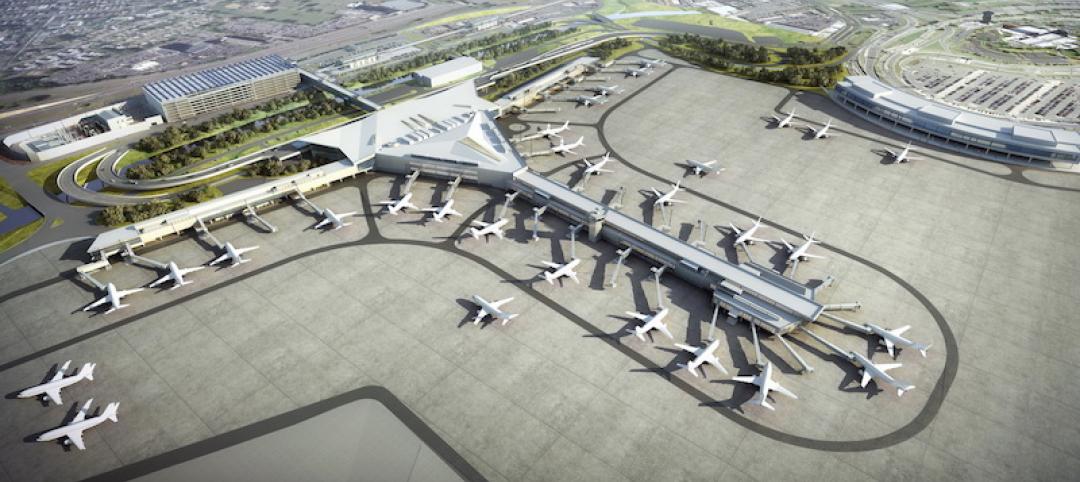
Airports | Jun 26, 2017
Newark Liberty International Airport breaks ground on $2.4 billion redevelopment project
The project includes a new 1 million-sf terminal building with 33 domestic aircraft gates.
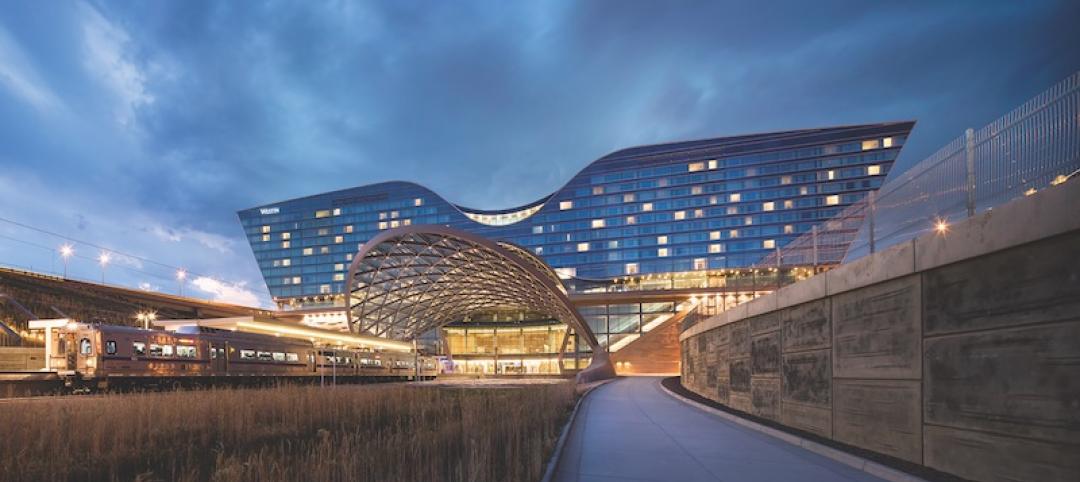
Building Team Awards | Jun 8, 2017
Missing link: Denver International Airport and Transit Center
Gold Award: A new mixed-use transit center fulfills Denver’s 28-year plan to improve access to the nation’s fifth-busiest airport.
Airports | May 15, 2017
Five trends for airport retail
CallisonRTKL Vice President Kevin Horn pinpoints how travel retail is changing dramatically.


