


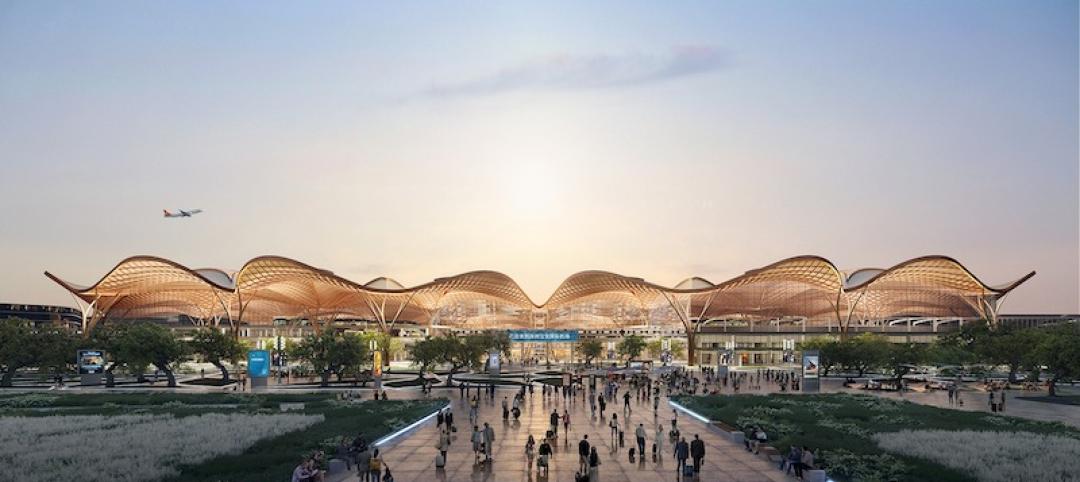
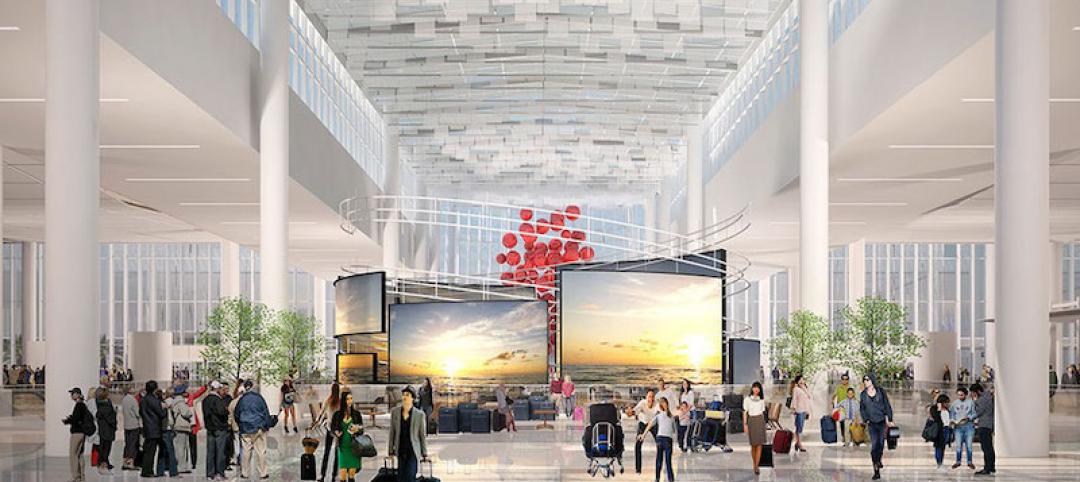
The recent evolution of airport terminals has been prompted largely by different patterns of passenger behavior in a post-9/11 world. Passengers have learned get to the airport earlier. They spend less time browsing pre-security retail, opting to queue up in often-lengthy security lines well before boarding. The result? Overcrowding in post-security areas, where retail and dining options have historically been lacking.
Curtis Fentress, Principal-in-Charge of design at Fentress Architects, says greater passenger volume has strained gate and restroom capabilities. In addition, the recent popularity of low-cost airlines has increased demand for post-security dining options.
“Many carriers don’t provide any food on the airplane,” Fentress says. “So the people who are getting to the airport earlier to make sure they get through security are waiting, and they want something to eat. If there’s any kind of flight delay, they know they might be stuck in the airport or stuck up in the air for a while without any food.”
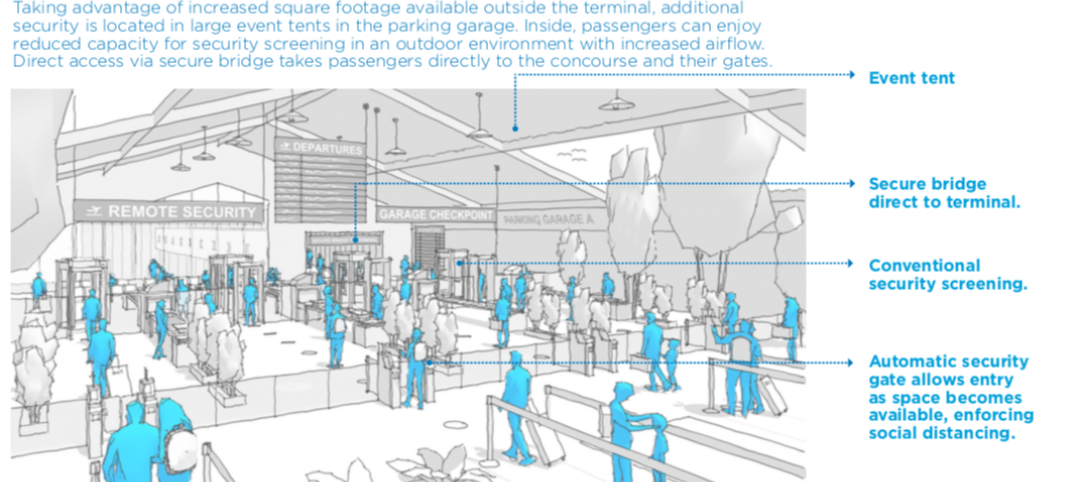
Airports are scrambling to respond with renovations and new terminals, even as they deal with TSA rules that can change in an instant. From CTX scanners—van-sized x-ray machines used to examine checked bags—to passenger scanners, the range of large equipment that terminals must accommodate just keeps morphing. Building Teams and their clients are adopting structural tactics that support change.
“We’re using more steel, which allows us to make longer distances between columns,” Fentress says. “The more long-span construction you can do, the more flexibility you have in the future.”
Top Air Terminal Sector Architecture Firms
| Rank | Company | 2013 Air Terminal Revenue Revenue |
| 1 | HOK | $47,074,837 |
| 2 | Gensler | 35,675,000 |
| 3 | Kohn Pedersen Fox Associates | 30,792,300 |
| 4 | Corgan | 26,376,420 |
| 5 | Fentress Architects | 26,333,785 |
| 6 | Stantec | 22,650,631 |
| 7 | RS&H | 22,050,000 |
| 8 | Skidmore, Owings & Merrill | 20,454,225 |
| 9 | PGAL | 17,120,000 |
| 10 | Heery International | 13,057,793 |
| 11 | HNTB Corp. | 10,900,639 |
| 12 | Leo A Daly | 9,490,737 |
| 13 | Gresham, Smith and Partners | 6,733,000 |
| 14 | SchenkelShultz Architecture | 6,179,000 |
| 15 | HKS | 4,087,622 |
| 16 | LS3P | 3,282,241 |
| 17 | Morris Architects | 2,795,000 |
| 18 | Clark Nexsen | 2,214,183 |
| 19 | Solomon Cordwell Buenz | 1,700,000 |
| 20 | CTA Architects Engineers | 1,187,913 |
| 21 | ZGF Architects | 929,658 |
| 22 | BRPH | 925,000 |
| 23 | Epstein | 762,000 |
| 24 | RTKL Associates | 677,000 |
| 25 | Integrus Architecture | 641,695 |
| 26 | Ware Malcomb | 196,500 |
| 27 | Rosser International | 158,668 |
| 28 | JRS Architect | 135,000 |
| 29 | Environetics | 112,443 |
| 30 | Parkhill, Smith & Cooper | 92,000 |
| 31 | Cuningham Group Architecture | 44,964 |
| 32 | Beyer Blinder Belle | 9,544 |
| 33 | Perkins+will | 6,836 |
| 34 | Ratio Architects | 5,368 |
Top Air Terminal Sector Engineering Firms
| Rank | Company | 2013 Air Terminal Revenue Revenue |
| 1 | Jacobs | $118,990,000 |
| 2 | URS Corp. | 83,069,612 |
| 3 | Burns & McDonnell | 48,010,000 |
| 4 | Parsons Brinckerhoff | 27,025,899 |
| 5 | Arup | 21,447,760 |
| 6 | Leidos | 16,810,000 |
| 7 | Ross & Baruzzini | 12,814,720 |
| 8 | AECOM Technology Corp. | 9,630,000 |
| 9 | STV | 5,260,000 |
| 10 | WSP Group | 3,640,000 |
| 11 | KPFF Consulting Engineers | 3,125,000 |
| 12 | Syska Hennessy Group | 2,933,760 |
| 13 | TLC Engineering for Architecture | 1,984,605 |
| 14 | TTG | 1,653,250 |
| 15 | Thornton Tomasetti | 1,620,411 |
| 16 | Walter P Moore and Associates | 1,596,212 |
| 17 | Sparling | 1,583,537 |
| 18 | Stanley Consultants | 1,526,482 |
| 19 | Aon Fire Protection Engineering Corp. | 1,500,000 |
| 20 | Graef | 1,267,799 |
| 21 | RMF Engineering | 1,200,000 |
| 22 | Coffman Engineers | 1,139,884 |
| 23 | Magnusson Klemencic Associates | 1,068,015 |
| 24 | RDK Engineers | 870,000 |
| 25 | Vanderweil Engineers | 856,900 |
| 26 | Wiss, Janney, Elstner Associates | 550,000 |
| 27 | Simpson Gumpertz & Heger | 550,000 |
| 28 | Martin/Martin | 494,691 |
| 29 | M-E Engineers | 400,000 |
| 30 | Newcomb & Boyd | 351,932 |
| 31 | Zak Companies | 351,488 |
| 32 | I. C. Thomasson Associates | 300,000 |
| 33 | Davis, Bowen & Friedel | 257,524 |
| 34 | Guernsey | 252,705 |
| 35 | Environmental Systems Design | 198,068 |
| 36 | CTLGroup | 180,000 |
| 37 | Joseph R. Loring & Associates | 175,000 |
| 38 | Heapy Engineering | 172,189 |
| 39 | Barge Waggoner Sumner & Cannon | 150,000 |
| 40 | GRW | 138,862 |
| 41 | Wallace Engineering | 131,000 |
| 42 | Dunham Associates | 90,000 |
| 43 | CJL Engineering | 81,400 |
| 44 | KJWW Engineering Consultants | 81,358 |
| 45 | P2S Engineering | 50,418 |
| 46 | Smith Seckman Reid | 44,419 |
| 47 | Bridgers & Paxton Consulting Engineers | 38,111 |
| 48 | Spectrum Engineers | 16,993 |
| 49 | Brinjac Engineering | 12,515 |
| 50 | French & Parrello Associates | 9,215 |
| 51 | AKF Group | 6,000 |
Top Air Terminal Sector Construction Firms
| Rank | Company | 2013 Air Terminal Revenue Revenue |
| 1 | Turner Construction | $487,680,000 |
| 2 | Hensel Phelps | 418,780,000 |
| 3 | PCL Construction | 328,069,635 |
| 4 | Walsh Group, The | 315,399,703 |
| 5 | Austin Commercial | 267,162,953 |
| 6 | Suffolk Construction | 170,270,605 |
| 7 | Balfour Beatty US | 154,058,403 |
| 8 | Clark Group | 131,741,104 |
| 9 | McCarthy Holdings | 127,000,000 |
| 10 | Manhattan Construction | 119,660,000 |
| 11 | Hunt Construction Group | 109,000,000 |
| 12 | URS Corp. | 83,069,612 |
| 13 | Hill International | 55,000,000 |
| 14 | Flintco | 54,400,000 |
| 15 | Walbridge | 46,000,000 |
| 16 | Skanska USA | 45,635,393 |
| 17 | Lend Lease | 35,107,000 |
| 18 | Weitz Company, The | 33,745,047 |
| 19 | HITT Contracting | 27,200,000 |
| 20 | Parsons Brinckerhoff | 27,025,899 |
| 21 | Brasfield & Gorrie | 25,926,312 |
| 22 | Gilbane | 22,031,250 |
| 23 | Tutor Perini Corp. | 19,320,308 |
| 24 | New South Construction | 18,923,000 |
| 25 | BlueScope Construction | 18,631,283 |
| 26 | O'Neil Industries/W.E. O'Neil | 18,433,037 |
| 27 | Holder Construction | 13,132,000 |
| 28 | Heery International | 13,057,793 |
| 29 | Yates Companies, The | 12,900,000 |
| 30 | Whiting-Turner Contracting Co., The | 11,991,159 |
| 31 | Beck Group, The | 11,096,174 |
| 32 | EMJ Corp. | 10,000,000 |
| 33 | James McHugh Construction | 9,527,392 |
| 34 | Robins & Morton | 6,370,178 |
| 35 | Messer Construction | 5,994,758 |
| 36 | W. M. Jordan Company | 5,812,917 |
| 37 | STV | 5,260,000 |
| 38 | Hill & Wilkinson | 4,766,000 |
| 39 | Consigli Construction | 3,278,099 |
| 40 | Kraus-Anderson Construction | 3,000,000 |
| 41 | Sundt Construction | 1,564,147 |
| 42 | JE Dunn Construction | 1,239,884 |
| 43 | Hoffman Construction | 1,000,000 |
| 44 | Hoar Construction | 4,000 |
Read BD+C's full 2014 Giants 300 Report
Related Stories
Airports | May 27, 2021
Grimshaw wins competition to design Shenzhen Airport East Integrated Transport Hub
The competition sought to find a design that created an integrated intermodal transport hub that could act as a new urban gateway.

Digital Twin | May 24, 2021
Digital twin’s value propositions for the built environment, explained
Ernst & Young’s white paper makes its cases for the technology’s myriad benefits.

Multifamily Housing | Mar 28, 2021
Smart home technology 101 for multifamily housing communities
Bulk-services Wi-Fi leads to better connectivity, products, and services to help multifamily developers create greater value for residents–and their own bottom line.

Market Data | Feb 24, 2021
2021 won’t be a growth year for construction spending, says latest JLL forecast
Predicts second-half improvement toward normalization next year.
Airports | Jan 26, 2021
Security concerns will drive demand for airport technology over the next five years
A new report explores where and what spending for “smart” airports is likely to focus on.

Giants 400 | Dec 16, 2020
Download a PDF of all 2020 Giants 400 Rankings
This 70-page PDF features AEC firm rankings across 51 building sectors, disciplines, and specialty services.

Giants 400 | Dec 2, 2020
2020 Airport Sector Giants: Top architecture, engineering, and construction firms in the U.S. airport facilities sector
AECOM, Hensel Phelps, and PGAL top BD+C's rankings of the nation's largest airport sector architecture, engineering, and construction firms, as reported in the 2020 Giants 400 Report.
Airports | Nov 20, 2020
Populous survey shows travelers are ready to return to the airport, with proper protection
Survey data points to achievable solutions for airports around the globe.

AEC Tech | Nov 12, 2020
The Weekly show: Nvidia's Omniverse, AI for construction scheduling, COVID-19 signage
BD+C editors speak with experts from ALICE Technologies, Build Group, Hastings Architecture, Nvidia, and Woods Bagot on the November 12 episode of "The Weekly." The episode is available for viewing on demand.

Airports | Oct 6, 2020
Airport of the Future global student design competition 2020 winners announced
Winning projects reimagine airport mobility in the year 2100 for one of the 20 busiest airports in the world.


