

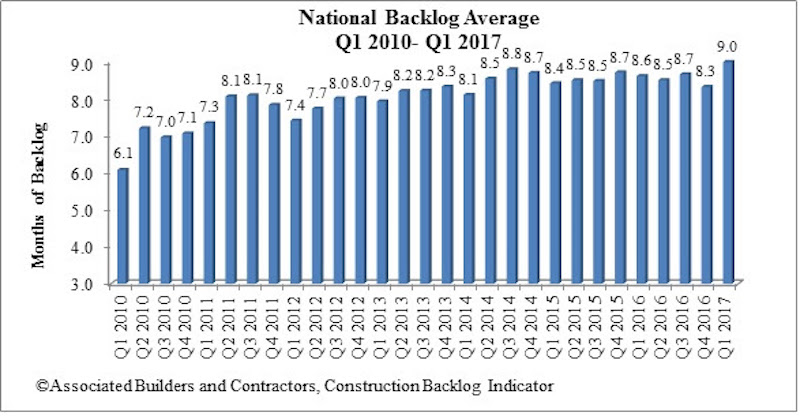
Associated Builders and Contractors (ABC) recently reported that its Construction Backlog Indicator (CBI) rose to 9 months during the first quarter of 2017, up 8.1 percent from the fourth quarter of 2016. CBI is up by 0.4 months, or 4 percent, on a year-over-year basis.
“This was a terrific report,” said ABC Chief Economist Anirban Basu. “For the first time in the series’ history, every category—firm size, industry and region—registered quarterly growth in CBI. Among the big winners were firms in the western United States and those with annual revenues between $30 million and $50 million per annum"
Highlights by Region
- Surging financial markets helped support activity in financial centers like New York, Philadelphia and Boston. Expanding cyber-security and life sciences activity supported markets as geographically diverse as Washington/Baltimore; Austin, Texas; Silicon Valley, Calif., and Seattle.
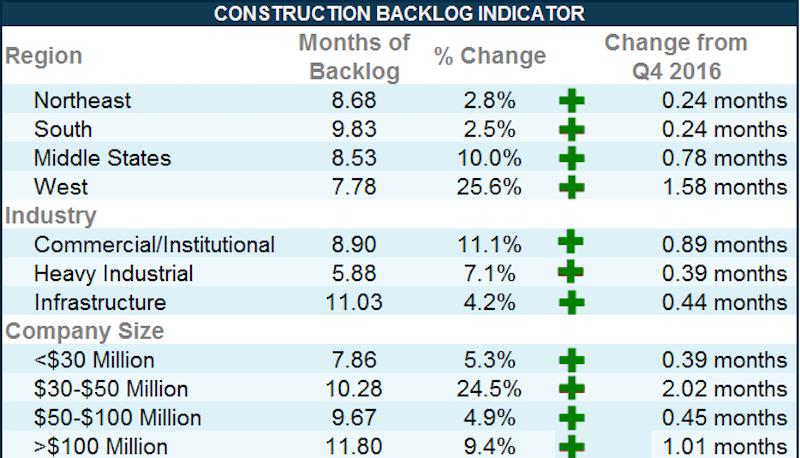
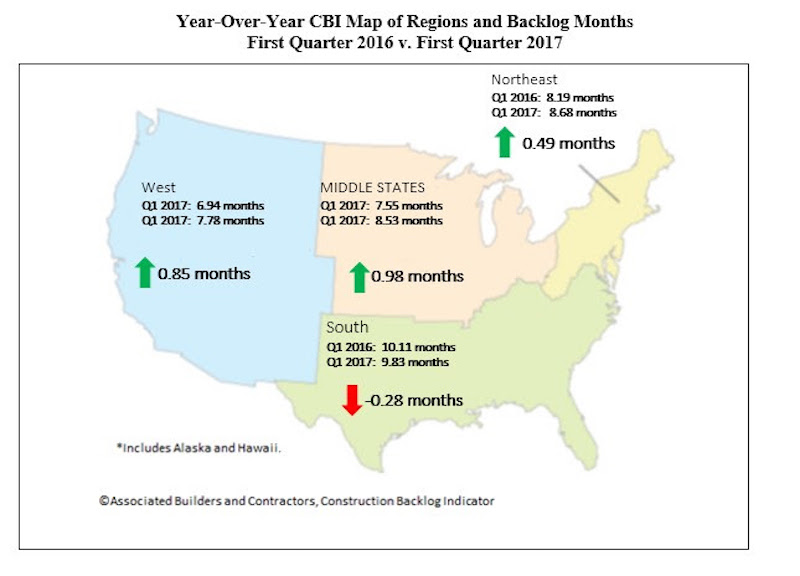
- Though backlog is slightly lower in the South on a year-over-year basis, it continues to report the lengthiest backlog, at 9.8 months. A number of markets remain extraordinarily active with respect to commercial construction, including Atlanta and Miami and Tampa, Fla. Distribution center construction also continues to be active due to a combination of busier seaports and the ongoing online retail boom.
- Backlog in the West was up by a remarkable 26 percent during the quarter. Part of this was due to statistical payback after a surprisingly weak fourth quarter. However, this is also a reflection of the rapid commercial growth in Seattle, Denver, Silicon Valley, San Diego, Phoenix and other population growth hotspots.
- Higher oil and natural gas prices helped to drive CBI higher in the Middle States. Backlog in the region expanded by a more-than-respectable 10 percent during the first quarter, and now stands at a healthy 8.5 months. Chicago continues to be a weak spot, however, registering slow job growth relative to other major U.S. metropolitan areas in recent quarters.
- Backlog in the Northeast rose to 8.7 months during the first quarter. Backlog is up by almost precisely half a month over the past year. The New York and Boston metropolitan areas remain particularly active.
Highlights by Industry
- Backlog in the commercial/institutional segment rose by more than 11 percent during the first quarter, and now stands at nearly 9 months. Backlog also expanded in the heavy industrial and infrastructure categories during the first three months of the year.
- Average backlog in the heavy industrial category rose to 5.88 months, but remains well below levels registered during much of the history of the series. Excluding the fourth quarter of 2016, this represents the lowest reading since the fourth quarter of 2014. There are many forces at work, including slowing auto sales, downward pressure on prices in a number of key manufacturing segments and soft exports.
- Backlog in the infrastructure category expanded during the first quarter and remains above historic levels. Actual infrastructure spending has been unimpressive in many categories recently, including wastewater, water supply, dams/levies and highway/street. Available survey data hint at a bit of a pickup in activity during the quarters ahead.
- Commercial/institutional backlog expanded to 8.9 months, matching its highest level since the third quarter of 2014. Though there are growing concerns regarding overbuilding in a number of metropolitan areas, and retail stores continue to close in large numbers, increases in office and hotel construction are helping to propel this category forward.
Highlights by Company Size
- Backlog for each of the four company size categories increased to start the year. Firms with revenues of $30 million to $50 million, many of which are in the commercial/institutional segments, were the clear outperformers in terms of expanding backlog during the first quarter of 2017. Backlog for this group of firms expanded by more than two months, indicating growing confidence among developers and other purchasers of construction services
- Backlog among firms with annual revenues of less than $30 million increased by 5.3 percent during the quarter. Over the course of time, the nonresidential construction recovery has broadened enough to encompass many of the smallest firms.
- The largest firms, those with annual revenues above $100 million and which are disproportionately represented in the infrastructure category, report the lengthiest backlog at 11.8 months. This was up by more than 9 percent during the quarter. Backlog for this group is approaching the one-year mark, which is considered to be a sign of significant health.
Related Stories

Industry Research | Feb 13, 2017
How thought leadership marketing can generate referrals for your firm
The most effective way to boost your reputation is through thought leadership marketing.

Market Data | Feb 1, 2017
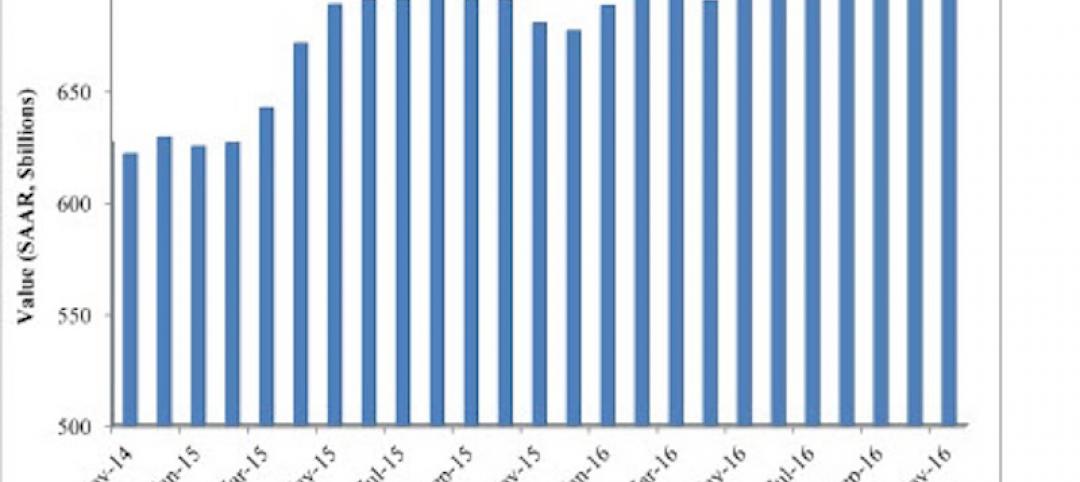
Nonresidential spending falters slightly to end 2016
Nonresidential spending decreased from $713.1 billion in November to $708.2 billion in December.
High-rise Construction | Jan 23, 2017
Growth spurt: A record-breaking 128 buildings of 200 meters or taller were completed in 2016
This marks the third consecutive record-breaking year for building completions over 200 meters.

Market Data | Jan 18, 2017
Fraud and risk incidents on the rise for construction, engineering, and infrastructure businesses
Seven of the 10 executives in the sector surveyed in the report said their company fell victim to fraud in the past year.

Market Data | Jan 18, 2017
Architecture Billings Index ends year on positive note
Architecture firms close 2016 with the strongest performance of the year.
Industry Research | Jan 12, 2017
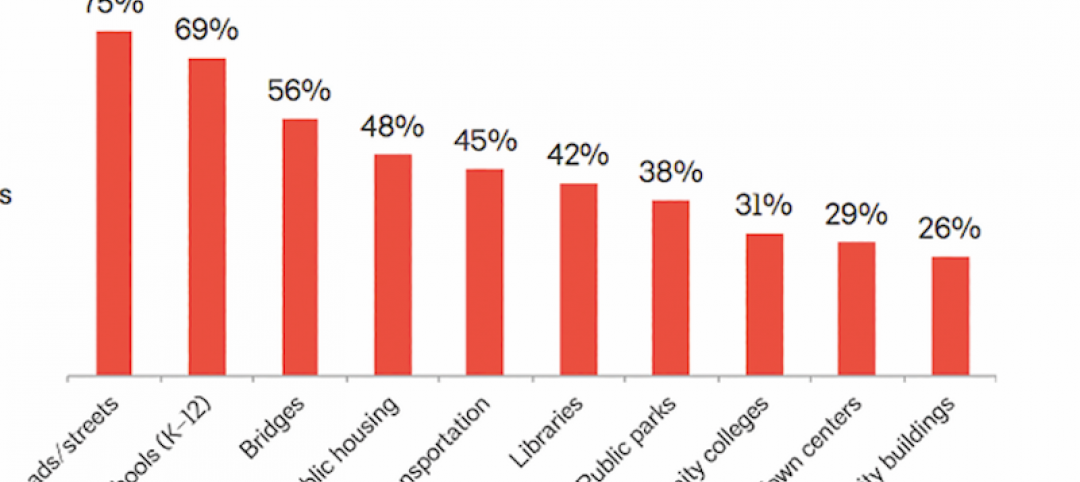
Are public buildings considered infrastructure?
A survey, conducted in October by The Harris Poll on behalf of AIA, asked 2,108 U.S. adults if they considered public buildings part of their community’s infrastructure.

Market Data | Jan 9, 2017
Trump market impact prompts surge in optimism for U.S. engineering firm leaders
The boost in firm leader optimism extends across almost the entire engineering marketplace.
Market Data | Jan 5, 2017
Nonresidential spending thrives in strong November spending report
Many construction firms have reported that they remain busy but have become concerned that work could dry up in certain markets in 2017 or 2018, says Anirban Basu, ABC Chief Economist.
Market Data | Dec 13, 2016
ABC predicts modest growth for 2017 nonresidential construction sector; warns of vulnerability for contractor
“The U.S. economy continues to expand amid a weak global economy and, despite risks to the construction industry, nonresidential spending should expand 3.5 percent in 2017,” says ABC Chief Economist Anirban Basu.
Market Data | Dec 2, 2016
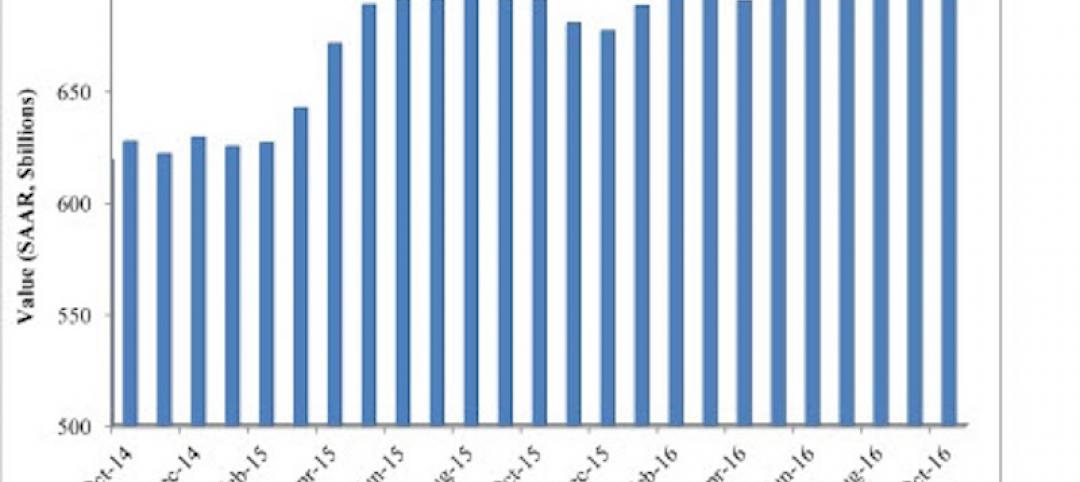
Nonresidential construction spending gains momentum
Nonresidential spending is now 2.6 percent higher than at the same time one year ago.


