

Associated Builders and Contractors reports that its Construction Backlog Indicator expanded to a record 9.9 months during the second quarter of 2018. Backlog is up 12.2% from the first quarter and 14% compared to the same time last year.
“Construction backlog has never been higher in the history of this series,” said ABC Chief Economist Anirban Basu. “While contractors collectively reported a higher backlog, it was the industrial contractor segment that had the largest increase in the second quarter. With industrial production rising and factory capacity utilization recovering, there is more demand for both improved and new industrial space. This was especially apparent among contractors in the southern United States, where backlog stands at 11.2 months and has increased 2.2 months over the past year.
“The disproportionate role played by technology companies in creating economic growth is also apparent in the data,” said Basu. “Contractors operating in tech-laden communities like San Jose, California; Seattle; Portland, Oregon; Provo/Salt Lake, Utah; and elsewhere continue to report very strong backlog. Given announcements of new, large-scale data centers and tech campuses, technology is positioned to be an ongoing driver of demand for construction services.
“During the first quarter we noted that there had been a significant uptick in survey participation that could have affected our findings due to shifting participant composition,” said Basu. “The second quarter was also characterized by elevated participation levels. It appears that higher participation is now the norm, and that the addition of survey participants has only served to render CBI a more reliable indicator.”
Highlights by Region
— Backlog in the South increased by more than one month on a quarterly basis and now sits just below its all-time high established during the third quarter of 2017. Construction backlog expansion continues to be driven by the usual suspects, including rapidly expanding metropolitan areas like Dallas and Austin, Texas; Atlanta; Orlando and Tampa/St. Petersburg, Florida; Charleston, South Carolina; Nashville, Tennessee; and Raleigh-Durham, North Carolina.
— Backlog in the Northeast rose to its highest level on record. Predictably, backlog growth continues to be led by strong commercial segments in the New York, Boston, Philadelphia, Washington and Baltimore metropolitan areas. There is also growing evidence of stronger construction activity in West Virginia and western Pennsylvania.
— The exception to the general trend of growing backlog is the Middle States, where backlog is down 0.7 months on a year-over-year basis. Many factors are at work, including relatively softer employment growth in the Chicago, Detroit and St. Louis metropolitan areas. This is the part of the country that is most vulnerable to low agricultural commodity prices, which continue to restrain overall economic performance in states like Iowa and Nebraska.
— Led by technology segments, backlog in the West continues to surge, up by an astonishing 3.9 months over the past year. Contractors in Seattle; Portland, Oregon; San Jose and Los Angeles, California; Denver; Salt Lake City; Boise, Idaho; and Phoenix can expect to remain ultra-busy for the foreseeable future, strongly suggesting that human capital shortfalls will continue to worsen.

Highlights by Industry
— Backlog in the commercial/institutional segment rebounded during the second quarter, increasing to 10.1 months. Backlog in this segment is up more than 20% from the second quarter of 2017. This is remarkable given expectations prevailing a year ago. Back then, many worried that a number of commercial segments had become overbuilt, at least in certain geographies. This suggested that backlog was vulnerable, with fewer new projects moving from the drawing board to construction. Instead, the accelerated growth of the U.S. economy has further bolstered demand for commercial space, driving up the segment’s construction backlog in the process.
— Backlog in the heavy industrial category reached an all-time high of 7.8 months during the second quarter, a testament to the ongoing expansion of industrial production in the United States. Construction spending related to manufacturing had declined in recent years but exhibited growth during the second quarter. Tariffs, potential trade wars and rising input prices remain risks to this segment’s near-term outlook.
— Backlog in the infrastructure category edged higher during the second quarter to 10.1 months. Despite the lack of a federal infrastructure package, a number of state governments are meaningfully increasing public infrastructure outlays as their finances continue to improve in conjunction with the U.S. economy, now in its 10th year of expansion. Based on U.S. Census Bureau data, construction spending in the water supply category is up 29% on a year-over-year basis, conservation and development (e.g. flood control) by 24%, transportation by nearly 21%, public safety-related spending by 17% and sewage and waste disposal by 11%.
Highlights by Company Size
— Large firms with annual revenues in excess of $100 million experienced a sharp increase in backlog. Surging business confidence would have a tendency to result in larger, potentially more risky projects moving forward. This disproportionately inures to the benefit of larger firms with the capacity to handle such projects. This segment’s backlog has increased by 2.4 months over the past year.
— Average backlog among firms with annual revenues between $50 million and $100 million increased by half a month and now stands at 11.6 months. Backlog in this segment has steadily ratcheted higher since a cyclical low experienced during the first quarter of 2016.
— Backlog for firms with between $30 million and $50 million in annual revenues surged 61% during the second quarter. Increased survey participation may be an underlying cause of this segment’s observed construction backlog volatility. However, even if one excludes new entrants to the survey, backlog among this group, which includes many specialty trade contractors, has clearly risen robustly over the past year.
— Backlog for firms with annual revenues of less than $30 million increased to 8.5 months during the second quarter, an all-time high. Backlog in this segment has risen almost precisely by a month over the past year.

Related Stories

Market Data | Jun 14, 2016
Transwestern: Market fundamentals and global stimulus driving economic growth
A new report from commercial real estate firm Transwestern indicates steady progress for the U.S. economy. Consistent job gains, wage growth, and consumer spending have offset declining corporate profits, and global stimulus plans appear to be effective.
Market Data | Jun 7, 2016
Global construction disputes took longer to resolve in 2015
The good news: the length and value of disputes in the U.S. fell last year, according to latest Arcadis report.

Market Data | Jun 3, 2016
JLL report: Retail renovation drives construction growth in 2016
Retail construction projects were up nearly 25% year-over-year, and the industrial and office construction sectors fared well, too. Economic uncertainty looms over everything, however.

Market Data | Jun 2, 2016
ABC: Nonresidential construction spending down in April
Lower building material prices, a sluggish U.S. economy, and hesitation among private developers all factor into the 2.1% drop.

Market Data | May 20, 2016
Report: Urban area population growth slows
Older Millennials are looking to buy homes and move away to more affordable suburbs and exurbs.
Market Data | May 17, 2016
Modest growth for AIA’s Architecture Billings Index in April
The American Institute of Architects reported the April ABI score was 50.6, down from the mark of 51.9 in the previous month. This score still reflects an increase in design services.

Market Data | Apr 29, 2016
ABC: Quarterly GDP growth slowest in two years
Bureau of Economic Analysis data indicates that the U.S. output is barely growing and that nonresidential investment is down.

Market Data | Apr 20, 2016
AIA: Architecture Billings Index ends first quarter on upswing
The multi-family residential sector fared the best. The Midwest was the only U.S. region that didn't see an increase in billings.
Building Technology | Apr 11, 2016
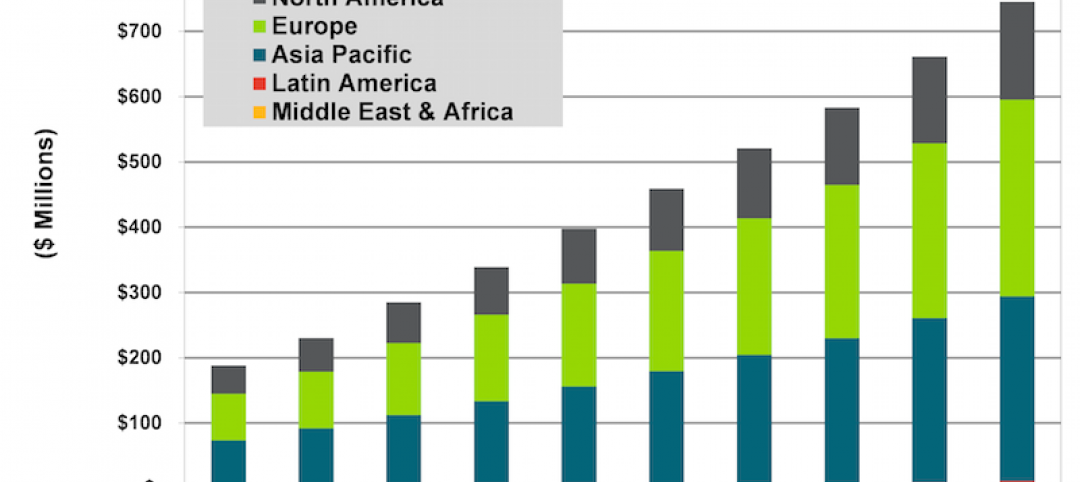
A nascent commercial wireless sensor market is poised to ascend in the next decade
Europe and Asia will propel that growth, according to a new report from Navigant.
Industry Research | Apr 7, 2016
CBRE provides latest insight into healthcare real estate investors’ strategies
Survey respondents are targeting smaller acquisitions, at a time when market cap rates are narrowing for different product types.


