

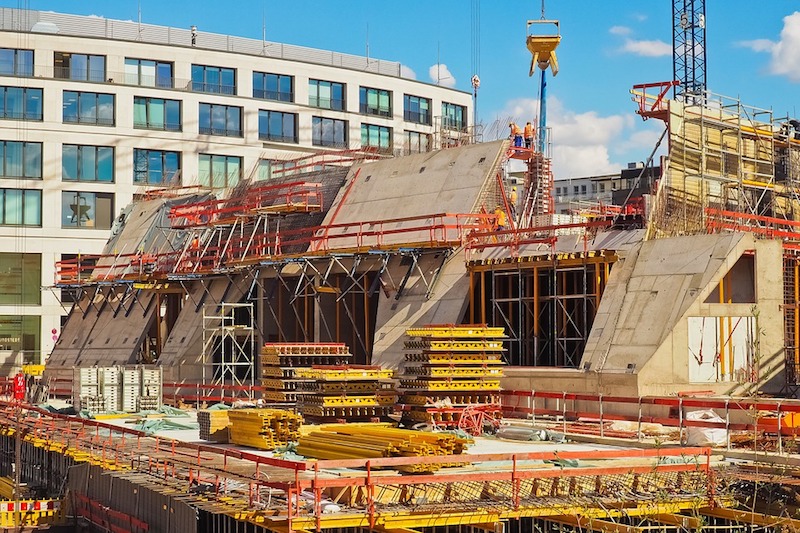
Associated Builders and Contractors reports that its Construction Backlog Indicator expanded to a record 9.9 months during the second quarter of 2018. Backlog is up 12.2% from the first quarter and 14% compared to the same time last year.
“Construction backlog has never been higher in the history of this series,” said ABC Chief Economist Anirban Basu. “While contractors collectively reported a higher backlog, it was the industrial contractor segment that had the largest increase in the second quarter. With industrial production rising and factory capacity utilization recovering, there is more demand for both improved and new industrial space. This was especially apparent among contractors in the southern United States, where backlog stands at 11.2 months and has increased 2.2 months over the past year.
“The disproportionate role played by technology companies in creating economic growth is also apparent in the data,” said Basu. “Contractors operating in tech-laden communities like San Jose, California; Seattle; Portland, Oregon; Provo/Salt Lake, Utah; and elsewhere continue to report very strong backlog. Given announcements of new, large-scale data centers and tech campuses, technology is positioned to be an ongoing driver of demand for construction services.
“During the first quarter we noted that there had been a significant uptick in survey participation that could have affected our findings due to shifting participant composition,” said Basu. “The second quarter was also characterized by elevated participation levels. It appears that higher participation is now the norm, and that the addition of survey participants has only served to render CBI a more reliable indicator.”
Highlights by Region
— Backlog in the South increased by more than one month on a quarterly basis and now sits just below its all-time high established during the third quarter of 2017. Construction backlog expansion continues to be driven by the usual suspects, including rapidly expanding metropolitan areas like Dallas and Austin, Texas; Atlanta; Orlando and Tampa/St. Petersburg, Florida; Charleston, South Carolina; Nashville, Tennessee; and Raleigh-Durham, North Carolina.
— Backlog in the Northeast rose to its highest level on record. Predictably, backlog growth continues to be led by strong commercial segments in the New York, Boston, Philadelphia, Washington and Baltimore metropolitan areas. There is also growing evidence of stronger construction activity in West Virginia and western Pennsylvania.
— The exception to the general trend of growing backlog is the Middle States, where backlog is down 0.7 months on a year-over-year basis. Many factors are at work, including relatively softer employment growth in the Chicago, Detroit and St. Louis metropolitan areas. This is the part of the country that is most vulnerable to low agricultural commodity prices, which continue to restrain overall economic performance in states like Iowa and Nebraska.
— Led by technology segments, backlog in the West continues to surge, up by an astonishing 3.9 months over the past year. Contractors in Seattle; Portland, Oregon; San Jose and Los Angeles, California; Denver; Salt Lake City; Boise, Idaho; and Phoenix can expect to remain ultra-busy for the foreseeable future, strongly suggesting that human capital shortfalls will continue to worsen.

Highlights by Industry
— Backlog in the commercial/institutional segment rebounded during the second quarter, increasing to 10.1 months. Backlog in this segment is up more than 20% from the second quarter of 2017. This is remarkable given expectations prevailing a year ago. Back then, many worried that a number of commercial segments had become overbuilt, at least in certain geographies. This suggested that backlog was vulnerable, with fewer new projects moving from the drawing board to construction. Instead, the accelerated growth of the U.S. economy has further bolstered demand for commercial space, driving up the segment’s construction backlog in the process.
— Backlog in the heavy industrial category reached an all-time high of 7.8 months during the second quarter, a testament to the ongoing expansion of industrial production in the United States. Construction spending related to manufacturing had declined in recent years but exhibited growth during the second quarter. Tariffs, potential trade wars and rising input prices remain risks to this segment’s near-term outlook.
— Backlog in the infrastructure category edged higher during the second quarter to 10.1 months. Despite the lack of a federal infrastructure package, a number of state governments are meaningfully increasing public infrastructure outlays as their finances continue to improve in conjunction with the U.S. economy, now in its 10th year of expansion. Based on U.S. Census Bureau data, construction spending in the water supply category is up 29% on a year-over-year basis, conservation and development (e.g. flood control) by 24%, transportation by nearly 21%, public safety-related spending by 17% and sewage and waste disposal by 11%.
Highlights by Company Size
— Large firms with annual revenues in excess of $100 million experienced a sharp increase in backlog. Surging business confidence would have a tendency to result in larger, potentially more risky projects moving forward. This disproportionately inures to the benefit of larger firms with the capacity to handle such projects. This segment’s backlog has increased by 2.4 months over the past year.
— Average backlog among firms with annual revenues between $50 million and $100 million increased by half a month and now stands at 11.6 months. Backlog in this segment has steadily ratcheted higher since a cyclical low experienced during the first quarter of 2016.
— Backlog for firms with between $30 million and $50 million in annual revenues surged 61% during the second quarter. Increased survey participation may be an underlying cause of this segment’s observed construction backlog volatility. However, even if one excludes new entrants to the survey, backlog among this group, which includes many specialty trade contractors, has clearly risen robustly over the past year.
— Backlog for firms with annual revenues of less than $30 million increased to 8.5 months during the second quarter, an all-time high. Backlog in this segment has risen almost precisely by a month over the past year.

Related Stories

Market Data | Nov 30, 2016
Marcum Commercial Construction Index reports industry outlook has shifted; more change expected
Overall nonresidential construction spending in September totaled $690.5 billion, down a slight 0.7 percent from a year earlier.

Industry Research | Nov 30, 2016
Multifamily millennials: Here is what millennial renters want in 2017
It’s all about technology and convenience when it comes to the things millennial renters value most in a multifamily facility.
Market Data | Nov 29, 2016
It’s not just traditional infrastructure that requires investment
A national survey finds strong support for essential community buildings.

Industry Research | Nov 28, 2016
Building America: The Merit Shop Scorecard
ABC releases state rankings on policies affecting construction industry.

Multifamily Housing | Nov 28, 2016
Axiometrics predicts apartment deliveries will peak by mid 2017
New York is projected to lead the nation next year, thanks to construction delays in 2016

Market Data | Nov 22, 2016
Construction activity will slow next year: JLL
Risk, labor, and technology are impacting what gets built.

Market Data | Nov 17, 2016
Architecture Billings Index rebounds after two down months
Decline in new design contracts suggests volatility in design activity to persist.

Market Data | Nov 11, 2016
Brand marketing: Why the B2B world needs to embrace consumers
The relevance of brand recognition has always been debatable in the B2B universe. With notable exceptions like BASF, few manufacturers or industry groups see value in generating top-of-mind awareness for their products and services with consumers.

Industry Research | Nov 8, 2016
Austin, Texas wins ‘Top City’ in the Emerging Trends in Real Estate outlook
Austin was followed on the list by Dallas/Fort Worth, Texas and Portland, Ore.

Market Data | Nov 2, 2016
Nonresidential construction spending down in September, but August data upwardly revised
The government revised the August nonresidential construction spending estimate from $686.6 billion to $696.6 billion.


