

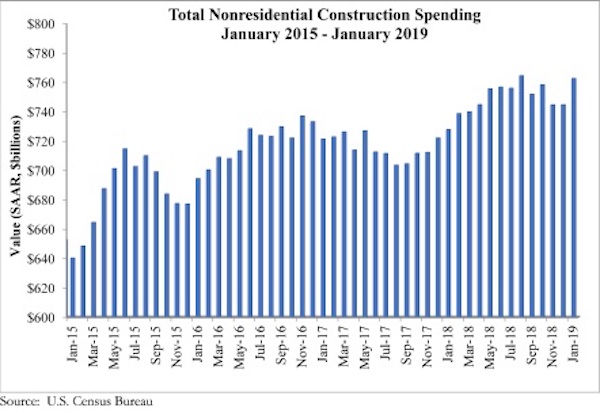
National nonresidential construction spending rose 2.4% in January, according to an Associated Builders and Contractors analysis of U.S. Census Bureau data released today. At a seasonally adjusted annualized rate, nonresidential spending totaled $762.5 billion for the month, an increase of 4.8% over the previous year. Public nonresidential construction spending expanded 4.9% in January and private spending increased 0.8%. Both public and private nonresidential spending are up 8.5% and 2.4%, respectively, on a yearly basis.
“An uptick in investment in certain infrastructure categories has been at the center of the ongoing nonresidential construction spending cycle,” said ABC Chief Economist Anirban Basu. “During the past year, construction spending has increased at rapid rates in conservation and development, highway and street, and transportation. While there has been much discussion about expanding infrastructure investment at the federal level, most of that investment has taken place at a state and local level, especially as government finances have improved in much of the nation, therefore supplying more support for infrastructure outlays. Significant job growth also has helped bolster income tax collections while rising real estate values have triggered improved property tax collections.
“Meanwhile, still reasonably strong consumer spending has helped support growing construction in segments like lodging,” said Basu. “Construction of data and fulfillment centers also has created demand for nonresidential construction services. The recent moderation in construction materials price increases has helped support construction starts because more developers and their financiers are concluding that new projects make business sense.
“While there has been some reduction in business and consumer confidence, the nonresidential construction spending cycle remains firmly in place for now,” said Basu. “Despite the recent dip in ABC’s Construction Backlog Indicator, backlogs remain sufficient to support solid nonresidential spending activity through the balance of 2019. And while many economists remain concerned about economic prospects in 2020 and beyond, nonresidential construction’s outlook remains benign at least into 2021.”


Related Stories

Senior Living Design | May 9, 2017
Designing for a future of limited mobility
There is an accessibility challenge facing the U.S. An estimated 1 in 5 people will be aged 65 or older by 2040.

Industry Research | May 4, 2017
How your AEC firm can go from the shortlist to winning new business
Here are four key lessons to help you close more business.

Engineers | May 3, 2017
At first buoyed by Trump election, U.S. engineers now less optimistic about markets, new survey shows
The first quarter 2017 (Q1/17) of ACEC’s Engineering Business Index (EBI) dipped slightly (0.5 points) to 66.0.

Market Data | May 2, 2017
Nonresidential Spending loses steam after strong start to year
Spending in the segment totaled $708.6 billion on a seasonally adjusted, annualized basis.

Market Data | May 1, 2017
Nonresidential Fixed Investment surges despite sluggish economic in first quarter
Real gross domestic product (GDP) expanded 0.7 percent on a seasonally adjusted annualized rate during the first three months of the year.

Industry Research | Apr 28, 2017
A/E Industry lacks planning, but still spending large on hiring
The average 200-person A/E Firm is spending $200,000 on hiring, and not budgeting at all.

Market Data | Apr 19, 2017
Architecture Billings Index continues to strengthen
Balanced growth results in billings gains in all regions.

Market Data | Apr 13, 2017
2016’s top 10 states for commercial development
Three new states creep into the top 10 while first and second place remain unchanged.

Market Data | Apr 6, 2017
Architecture marketing: 5 tools to measure success
We’ve identified five architecture marketing tools that will help your firm evaluate if it’s on the track to more leads, higher growth, and broader brand visibility.

Market Data | Apr 3, 2017
Public nonresidential construction spending rebounds; overall spending unchanged in February
The segment totaled $701.9 billion on a seasonally adjusted annualized rate for the month, marking the seventh consecutive month in which nonresidential spending sat above the $700 billion threshold.


