

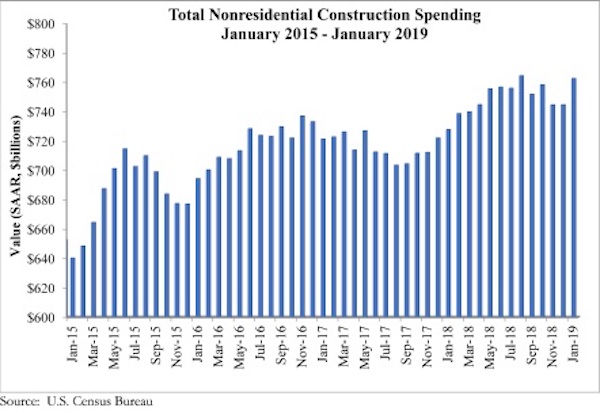
National nonresidential construction spending rose 2.4% in January, according to an Associated Builders and Contractors analysis of U.S. Census Bureau data released today. At a seasonally adjusted annualized rate, nonresidential spending totaled $762.5 billion for the month, an increase of 4.8% over the previous year. Public nonresidential construction spending expanded 4.9% in January and private spending increased 0.8%. Both public and private nonresidential spending are up 8.5% and 2.4%, respectively, on a yearly basis.
“An uptick in investment in certain infrastructure categories has been at the center of the ongoing nonresidential construction spending cycle,” said ABC Chief Economist Anirban Basu. “During the past year, construction spending has increased at rapid rates in conservation and development, highway and street, and transportation. While there has been much discussion about expanding infrastructure investment at the federal level, most of that investment has taken place at a state and local level, especially as government finances have improved in much of the nation, therefore supplying more support for infrastructure outlays. Significant job growth also has helped bolster income tax collections while rising real estate values have triggered improved property tax collections.
“Meanwhile, still reasonably strong consumer spending has helped support growing construction in segments like lodging,” said Basu. “Construction of data and fulfillment centers also has created demand for nonresidential construction services. The recent moderation in construction materials price increases has helped support construction starts because more developers and their financiers are concluding that new projects make business sense.
“While there has been some reduction in business and consumer confidence, the nonresidential construction spending cycle remains firmly in place for now,” said Basu. “Despite the recent dip in ABC’s Construction Backlog Indicator, backlogs remain sufficient to support solid nonresidential spending activity through the balance of 2019. And while many economists remain concerned about economic prospects in 2020 and beyond, nonresidential construction’s outlook remains benign at least into 2021.”


Related Stories

Market Data | Jun 21, 2017
Design billings maintain solid footing, strong momentum reflected in project inquiries/design contracts
Balanced growth results in billings gains in all sectors.

Market Data | Jun 16, 2017
Residential construction was strong, but not enough, in 2016
The Joint Center for Housing Studies’ latest report expects minorities and millennials to account for the lion’s share of household formations through 2035.

Industry Research | Jun 15, 2017
Commercial Construction Index indicates high revenue and employment expectations for 2017
USG Corporation (USG) and U.S. Chamber of Commerce release survey results gauging confidence among industry leaders.

Market Data | Jun 2, 2017
Nonresidential construction spending falls in 13 of 16 segments in April
Nonresidential construction spending fell 1.7% in April 2017, totaling $696.3 billion on a seasonally adjusted, annualized basis, according to analysis of U.S. Census Bureau data released today by Associated Builders and Contractors.

Industry Research | May 25, 2017
Project labor agreement mandates inflate cost of construction 13%
Ohio schools built under government-mandated project labor agreements (PLAs) cost 13.12 percent more than schools that were bid and constructed through fair and open competition.

Market Data | May 24, 2017
Design billings increasing entering height of construction season
All regions report positive business conditions.

Market Data | May 24, 2017
The top franchise companies in the construction pipeline
3 franchise companies comprise 65% of all rooms in the Total Pipeline.

Industry Research | May 24, 2017
These buildings paid the highest property taxes in 2016
Office buildings dominate the list, but a residential community climbed as high as number two on the list.

Market Data | May 16, 2017
Construction firms add 5,000 jobs in April
Unemployment down to 4.4%; Specialty trade jobs dip slightly.

Multifamily Housing | May 10, 2017
May 2017 National Apartment Report
Median one-bedroom rent rose to $1,012 in April, the highest it has been since January.


